Free - KPI Template PPT Presentation Slide With Bar Chart

Free
KPI Template PPT Presentation Slide With Bar Chart
P.ID : 66123
    1.9K+ views
    473 Downloads
    Get Custom Slides by Experts
    Instantly Access Templates in PowerPoint

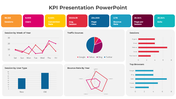
    Engaging KPI Scorecard Chart PowerPoint Template

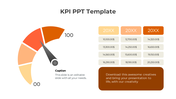
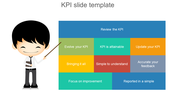
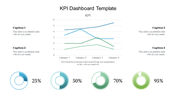
    Our KPI PPT Template Presentation Slide mainly focuses on showcasing the Achievement perfectly. This template is essential to explain the business target and goal to the audience. KPI Scorecard template contains three charts in which Users can add data. This template is used in company plan meetings or business meetings. Also,  Earn a smile on your audience's face with our KPI presentation. Users can use this template for any goal presentation with minor changes.

    About this template:

    This KPI template is mainly used to show a statistical record of Achievement. It is a colorful template with three charts. This template has tables to add the user's goal data. This KPI PPT Template Presentation Slide has all the essential items, so you don't have to worry about anything. The chart designs of this PowerPoint help increase the interest of the audience. We also have a pack of KPI chart PPT slides. You can check them later.

    Features of this template

    • Fully Customizable (shape, color, size & text)
    • This template has a board theme, and you can also choose the color
    • Drag and drop image placeholder
    • Huge Collections of KPI slides to impress your audience
    • It supports an aspect ratio of 16:9 and 4:3 format
    • Highly compatible with PowerPoint, Google Slides and Canva template.
    Advertisement

    You May Also Like These PowerPoint Templates

    Add to Wishlist
    Download
    AI Customize
    Financial highlights slide with bar chart and circular gauges tracking sales, operating income, and expenses.
    Add to Wishlist
    Download
    AI Customize
    KPI dashboard with a dual-line graph, balance performance gauge, and quarterly income metrics.
    Free
    Add to Wishlist
    Download
    AI Customize
    Dashboard with line graphs, a circular chart with three segments, and labeled financial metrics, in red, orange, and green.
    Add to Wishlist
    Download
    AI Customize
    Dashboard slide showing Zantedeschia, Celosia, and Calendula growth data with a bar chart from 2012 to 2017.
    Add to Wishlist
    Download
    AI Customize
    Business dashboard with progress indicators for promotion, channel management, and revenue metrics.
    Add to Wishlist
    Download
    AI Customize
    A dashboard style slide showing plant growth data for Zantedeschia, Celosia, and Calendula with gauge charts and a bar graph.
    Add to Wishlist
    Download
    AI Customize
    Botanical data dashboard template  showing performance metrics for flower species, featuring line and bar charts.
    Free
    Add to Wishlist
    Download
    AI Customize
    Colorful dashboard style meters PPT slide with captions and placeholder text.
    Free
    Add to Wishlist
    Download
    AI Customize
    Dashboard layout featuring a line graph, pie chart, net worth value, and categorized assets and liabilities in green theme.
    Free
    Add to Wishlist
    Download
    AI Customize
    Executive dashboard slide featuring different vehicles like bike, car, container, train, and plane with title sections.
    Add to Wishlist
    Download
    AI Customize
    KPI dashboard featuring a funnel chart, audience metrics, bar graph, and a circular chart with 2021 data.
    Free
    Add to Wishlist
    Download
    AI Customize
    Executive dashboard template featuring six blue columns with titles and alternating light and dark blue text boxes.
    Add to Wishlist
    Download
    AI Customize
    KPI dashboard template with four gauges in blue, green, orange, and red, alongside a flowchart with colored boxes.
    Free
    Add to Wishlist
    Download
    AI Customize
    Slide featuring a bar graph and line chart showing monthly money transactions, alongside silhouettes of people shaking hands.
    Free
    Add to Wishlist
    Download
    AI Customize
    PowerPoint template featuring a colorful dashboard with bar graphs, pie charts, progress rings, and a timeline for data.
    Free
    Add to Wishlist
    Download
    AI Customize
    Free KPI PPT Template For Presentation & Google Slides
    Add to Wishlist
    Download
    AI Customize
    KPI dashboard slide featuring six charts vertical bars, horizontal bars, area graph, pie chart, and column bar graphs.
    Add to Wishlist
    Download
    AI Customize
    KPI dashboard highlighting supplier statistics using donut charts, order-to-invoice process, and bar charts.
    Free
    Add to Wishlist
    Download
    AI Customize
    A slide with a sleek dashboard design that includes colorful data visualizations like pie charts, graphs, and progress bars.
    Free
    Add to Wishlist
    Download
    AI Customize
    KPI slide displaying three circular meters with red, green, and orange sections, with text descriptions on the right.