Chart PowerPoint Template and Google Slides

 Canva
Canva
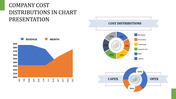
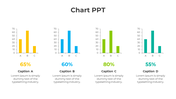


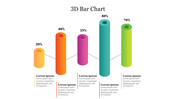
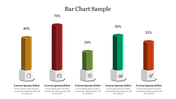
Chart PowerPoint Template and Google Slides
The "Chart PowerPoint Template and Google Slides" features a visually appealing chart presentation with four 3D bars representing different categories: business, target, growth, and profit. Each bar is labeled and accompanied by its corresponding percentage, presented in vibrant colors, and complemented by icons, enhancing the visual appeal and clarity of the chart.
This template is ideal for professionals across various industries who need to present data, statistics, or percentages related to business performance, targets, growth, and profits. It can be used by business analysts, financial analysts, project managers, marketers, and anyone else who wants to visually illustrate key metrics and performance indicators.
Compatibility with PowerPoint and Google Slides. Available in "16:9" and "4:3" aspect ratios, as well as Zip formats, ensuring compatibility with various screen dimensions and presentation preferences. Free template with 100% customizable features. Download the Chart PowerPoint Template and Google Slides now.


You May Also Like These PowerPoint Templates

Add to Wishlist
Download
Edit

Add to Wishlist
Download
Edit

Add to Wishlist
Download
Edit


Add to Wishlist
Download
Edit

Add to Wishlist
Download
Edit

Add to Wishlist
Download
Edit


Add to Wishlist
Download
Edit

Add to Wishlist
Download
Edit


Add to Wishlist
Download
Edit

Add to Wishlist
Download
Edit


Showing20 of69,218 templates