Editable Kano Model PowerPoint and Google Slides Templates

Pack of 11 slides
P.ID : 67618
Advertisement
502 views
65 Downloads
Get Custom Slides by Experts
Instantly Access Templates in PowerPoint

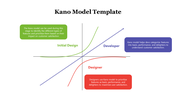
Kano Model Presentation Slides

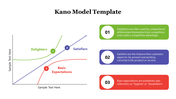
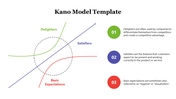
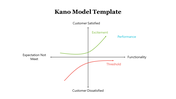
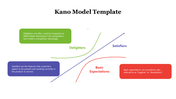
Unleash the power of data-driven decision-making with the revolutionary Keno Model. Like a masterful conductor, it harmonizes intricate patterns from vast datasets, revealing invaluable insights and predictions. With its robust algorithm and advanced analytics, the Keno Model empowers businesses to optimize strategies, mitigate risks, and seize opportunities. Our presentation template brings this cutting-edge model to life, allowing you to showcase its capabilities and guide your audience through a transformative journey of informed decision-making. Unlock the potential of your data and revolutionize your presentations with the Keno Model template.

Feature of the templates:

  • 100% customizable slides and easy to download.
  • Slides are available in different nodes & colors.
  • The slide contains 16:9 and 4:3 formats.
  • Easy to change the colors of the slide quickly.
  • Highly compatible with PowerPoint and Google Slides.
  • Well-crafted template with an instant download facility.

You May Also Like These PowerPoint Templates

Add to Wishlist
Download
AI Customize
Kano model analysis graph illustrating delighters, satisfiers, and basic features with curved lines and caption areas.
Add to Wishlist
Download
AI Customize
A green circular pie chart showing percentage, and four colored sales data graphs for different years.
Add to Wishlist
Download
AI Customize
A donut chart with multiple segments in different colors next to a table displaying statistics and percentage changes.
Add to Wishlist
Download
AI Customize
Progress bar slide with colored bars representing market, business, timeline, and goal categories with percentages.
Add to Wishlist
Download
AI Customize
A curved graph showing stages of change over time and morale axis with five colored circular markers.
Add to Wishlist
Download
AI Customize
Endowment effect graph depicting reference points, gains, losses, and a description explaining ownership bias in psychology.
Add to Wishlist
Download
AI Customize
Skewed graph with a curved line depicting negative skewness, marked with three highlighted points along the curve.
Add to Wishlist
Download
AI Customize
Graph displaying the absolute value function in blue with a V-shape, with a caption on the right.
Add to Wishlist
Download
AI Customize
Graph diagram illustrating the Dunning Kruger Syndrome, showcasing the relationship between confidence and competence.
Add to Wishlist
Download
AI Customize
Smooth red quartic curve on an axis, showing roots and peaks, with descriptive text section to the right.
Add to Wishlist
Download
AI Customize
Creative graph slide with colorful numbered captions and a bar chart displaying varying percentage values from 40% to 80%.
Add to Wishlist
Download
AI Customize
A slide featuring four bar graphs labeled A, B, C, and D with caption areas underneath, connected by dotted arrows.
Free
Add to Wishlist
Download
AI Customize
Chevron graph template with four percentage columns and captions below each bar.
Add to Wishlist
Download
AI Customize
Kano Customer Model chart slide showing the categories Delighters, Basic, and Satisfiers with labeled arrows.
Add to Wishlist
Download
AI Customize
Kano model with a red arrow and orange, red, and green zones for user satisfaction placed in a white background.
Add to Wishlist
Download
AI Customize
Circular segmented graph showing percentages from 52% to 80% in green and blue tones, with text captions on the right.
Add to Wishlist
Download
AI Customize
Graph illustrating the Endowment Effect, showing value versus outcome with gains and losses marked.
Add to Wishlist
Download
AI Customize
Best Graph Business Growth PowerPoint Template Slide
Add to Wishlist
Download
AI Customize
Graphics PowerPoint slide featuring five vertical progress bars with different percentages and icons with captions.
Add to Wishlist
Download
AI Customize
Story plot diagram with beginning, middle, and end sections in pastel colors, connected by icons on a line graph.
Add to Wishlist
Download
AI Customize
Layered area chart with red and green segments, numeric axes, and two icons below with captions on a white background.
Add to Wishlist
Download
AI Customize
Infographic PowerPoint slide with four blue bars of increasing height, each associated with a caption and placeholder text.
Add to Wishlist
Download
AI Customize
Slide showing a gray-shaded area graph with red circular markers and captions for three highlighted years.
Add to Wishlist
Download
AI Customize
Graph illustrating the yearly findings of how to find PowerPoint templates from 2016 to 2023 with two data series.
Free
Add to Wishlist
Download
AI Customize
Slide with green radar chart, satellite dish on the right, and two labeled statistical hexagonal sections below.
Add to Wishlist
Download
AI Customize
Line graph representing the Kubler Ross Model with seven emotional stages marked by colored points on a curve.
Add to Wishlist
Download
AI Customize
Line graph displaying trends across four categories with three distinct colored lines and percentage highlights below.
Free
Add to Wishlist
Download
AI Customize
Weekly bar chart with green bars showing Style 1 to Style 4 timelines, accompanied by a tilted yellow note box.
Add to Wishlist
Download
AI Customize
PowerPoint slide showing a quick fact about music's impact, with a graph displaying intelligence levels and famous composers.
Add to Wishlist
Download
AI Customize
PowerPoint template showing a line graph with three products A, B, and C plotted over time from 2015 to 2019.
Free
Add to Wishlist
Download
AI Customize
Slide with a sloping bar graph in green and gray segments, three numbered points, and a text box on the right.
Add to Wishlist
Download
AI Customize
Two vertical bar charts with three columns each, alongside captions with percentages in varying shades of orange.
Free
Add to Wishlist
Download
AI Customize
Revenue analysis slide with bar chart, financial icon, and two descriptive sections for customer metrics.
Free
Add to Wishlist
Download
AI Customize
3D bar graph with six green bars of varying heights, labeled placeholders, and a gray sidebar with text blocks.
Free
Add to Wishlist
Download
AI Customize
Visual layout of various charts, including area and bar graphs, arranged in a grid format with caption areas.