Creative Graphs In PowerPoint Presentation Template

Creative graph slide with colorful numbered captions and a bar chart displaying varying percentage values from 40% to 80%.
P.ID : 62102
    530 views
    74 Downloads
    Get Custom Slides by Experts
    Instantly Access Templates in PowerPoint

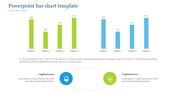
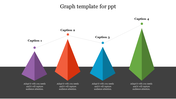
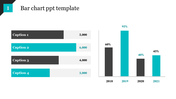
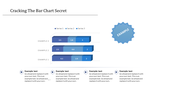
    Creative Graphs Presentation Slide

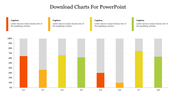
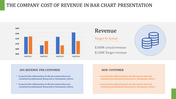
    Are you tired of the same old boring graphs? Add a touch of creativity to your presentations with creative graphs! These unique graphs not only add visual interest but also help to convey complex data in a more easily observe way. With a variety of design options and customization capabilities, creative graphs can be tailored to fit any presentation style or branding. Let your data stand out with the use of creative graphs. This template is text holder and colorful circles allow you to present the descriptions. This template is easy to use with text holder and colorful circles.

    Features of the template:

    • 100% customizable slide and easy to download.
    • Easy to change the slide's colors.
    • The template contains 16:9 and 4:3 formats.
    • Highly compatible with PowerPoint and Google Slides.
    • This slide has a colorful design pattern.
    Advertisement

    You May Also Like These PowerPoint Templates

    Add to Wishlist
    Download
    AI Customize
    A curve graph with two lines in teal and black and six labeled points, with corresponding captions on the right.
    Add to Wishlist
    Download
    AI Customize
    A collection of story arc slides featuring graphs illustrating rising action, climax, and resolution points for storytelling.
    Add to Wishlist
    Download
    AI Customize
    An S shaped curve graph with three key points, illustrating growth or change over time with captions.
    Add to Wishlist
    Download
    AI Customize
    Positively skewed histogram with blue bars, three highlighted data points, and a centered orange button at the bottom.
    Add to Wishlist
    Download
    AI Customize
    A bell curve chart slide with an orange shaded area representing percentages for standard deviations.
    Add to Wishlist
    Download
    AI Customize
    A four quadrant graph with colorful sections labeled from 01 to 04 in the center. Each quadrant has placeholder text area.
    Add to Wishlist
    Download
    AI Customize
    Graph representation of the Dunning Kruger effect, mapping confidence levels from know nothing to expert across four stages.
    Add to Wishlist
    Download
    AI Customize
    Editable Kano Model PowerPoint and Google Slides Themes
    Add to Wishlist
    Download
    AI Customize
    Bradley curve chart with four sections in shades of maroon, and orange, illustrating progression through stages.
    Add to Wishlist
    Download
    AI Customize
    A chart with a bell curve divided into five colored sections illustrating market segments with percentages.
    Add to Wishlist
    Download
    AI Customize
    Graphical representation of a story arc showing stages from exposition to resolution, with labeled points for each action.
    Add to Wishlist
    Download
    AI Customize
    Collection of plot diagram templates showing rising action, climax, and resolution in a line graph style.
    Add to Wishlist
    Download
    AI Customize
    Line graph template with two lines showing data across seven items, with percentage icons and captions below.
    Add to Wishlist
    Download
    AI Customize
    Conflict management slide with a slope line graph marking stages in four colored arrows, ending in a yellow star.
    Add to Wishlist
    Download
    AI Customize
    Spider graph displaying data from 2018 to 2023 with two data sets highlighted in orange and pink lines.
    Add to Wishlist
    Download
    AI Customize
    Slide deck showing the Kubler Ross change curve with colorful dots on a line graph illustrating emotional stages over time.
    Add to Wishlist
    Download
    AI Customize
    Perceptual map slide showcasing product placement across geographical regions Europe, Asia, and Africa in colored boxes.
    Add to Wishlist
    Download
    AI Customize
    Graph showing a positively skewed distribution, with a longer tail extending to the right, indicating more high values.