Endowment Effect PPT Slide Template Presentation Design

Graph illustrating the Endowment Effect, showing value versus outcome with gains and losses marked.
P.ID : 57177
    68 views
    5 Downloads
    Get Custom Slides by Experts
    Instantly Access Templates in PowerPoint

    Elegant Endowment PowerPoint Presentation Template

    Download this best Endowment Effect Presentation Slide Design to create a stunning presentation. In addition, you can enhance the graphical appearance with this full customization option. Let your perspectives exceed your dreams and desires. This template makes you stand out from the crowd.

    About the template

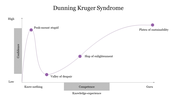
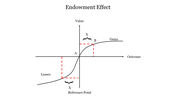
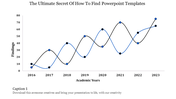
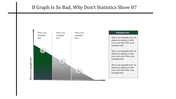
    Simple Endowment Effect Presentation Slide Design is created to help you present all the content intelligently. The template holds a simple graph to show the losses and gains of your endowment received. Examine points about your values and outcomes with dispense information. In addition, the white background adds more contrast to your text and content. You can choose this simple yet effective graph PPT template to create immense satisfaction for the audience.

    Features of the Template:

    • Innovative slide background designs
    • 100% easy to edit and customize slides
    • The slide contained 16:9 and 4:3 format.
    • Easy to change the slide colors quickly.
    • The elegant look of this template will give life to your presentation.
    • Crisp and clear font styles.
    • Fantastic slide template.
    Advertisement

    You May Also Like These PowerPoint Templates

    Add to Wishlist
    Download
    AI Customize
    Narrative arc slide displaying key plot stages with placeholder text areas.
    Add to Wishlist
    Download
    AI Customize
    Line graph slide with two data series in red and yellow, showing item based data fluctuations and a text caption.
    Add to Wishlist
    Download
    AI Customize
    Graph showing an upward curve with captions along key points, indicating growth or improvement over time.
    Add to Wishlist
    Download
    AI Customize
    A curve graph with two lines in teal and black and six labeled points, with corresponding captions on the right.
    Add to Wishlist
    Download
    AI Customize
    A collection of story arc slides featuring graphs illustrating rising action, climax, and resolution points for storytelling.
    Add to Wishlist
    Download
    AI Customize
    An S shaped curve graph with three key points, illustrating growth or change over time with captions.
    Add to Wishlist
    Download
    AI Customize
    Positively skewed histogram with blue bars, three highlighted data points, and a centered orange button at the bottom.
    Add to Wishlist
    Download
    AI Customize
    A bell curve chart slide with an orange shaded area representing percentages for standard deviations.
    Add to Wishlist
    Download
    AI Customize
    A four quadrant graph with colorful sections labeled from 01 to 04 in the center. Each quadrant has placeholder text area.
    Add to Wishlist
    Download
    AI Customize
    Graph representation of the Dunning Kruger effect, mapping confidence levels from know nothing to expert across four stages.
    Add to Wishlist
    Download
    AI Customize
    Editable Kano Model PowerPoint and Google Slides Themes
    Add to Wishlist
    Download
    AI Customize
    Bradley curve chart with four sections in shades of maroon, and orange, illustrating progression through stages.
    Add to Wishlist
    Download
    AI Customize
    A chart with a bell curve divided into five colored sections illustrating market segments with percentages.
    Add to Wishlist
    Download
    AI Customize
    Graph illustrating the law of diminishing marginal return with a curved line between input and output, with labeled sections.
    Add to Wishlist
    Download
    AI Customize
    Graphical representation of a story arc showing stages from exposition to resolution, with labeled points for each action.
    Add to Wishlist
    Download
    AI Customize
    Collection of plot diagram templates showing rising action, climax, and resolution in a line graph style.
    Add to Wishlist
    Download
    AI Customize
    Line graph template with two lines showing data across seven items, with percentage icons and captions below.
    Add to Wishlist
    Download
    AI Customize
    Conflict management slide with a slope line graph marking stages in four colored arrows, ending in a yellow star.