Best Story Arc Presentation and Google Slides Templates

Pack of 13 slides
P.ID : 61248
Advertisement
1.3K+ views
170 Downloads
Get Custom Slides by Experts
Instantly Access Templates in PowerPoint

Story Arc Presentation Slide

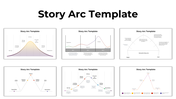
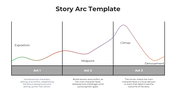
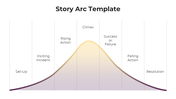
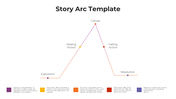
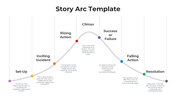
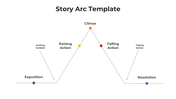
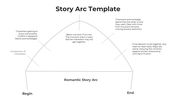
A story arc is a narrative tool used to map out the progression of a story from beginning to end. It typically follows a pattern of exposition, rising action, climax, falling action, and resolution. The story arc PPT template provides 13 slides to help you effectively communicate your story's structure and development. Whether you're creating a presentation for a client or sharing a story with friends, this template can help you organize your ideas and captivate your audience. Try the story arc PPT template and bring your story to life!

Features of the template

  • 100% customizable slides and easy to download.
  • Slides are available in different colors
  • The slide has 4:3 and 16:9 formats.
  • Easy to change the slide colors quickly.
  • Appealing Presentation to impress an audience.
  • Create feature-rich slide presentations.
  • An eye-pleasing color slide helps to give a catchy display.
  • Both PPT and Google Slides are compatible with it.
  • Well-designed story arc presentations.

You May Also Like These PowerPoint Templates

Add to Wishlist
Download
AI Customize
Skewed graph with a curved line depicting negative skewness, marked with three highlighted points along the curve.
Add to Wishlist
Download
AI Customize
Graph displaying the absolute value function in blue with a V-shape, with a caption on the right.
Add to Wishlist
Download
AI Customize
Graph diagram illustrating the Dunning Kruger Syndrome, showcasing the relationship between confidence and competence.
Add to Wishlist
Download
AI Customize
Smooth red quartic curve on an axis, showing roots and peaks, with descriptive text section to the right.
Add to Wishlist
Download
AI Customize
Creative graph slide with colorful numbered captions and a bar chart displaying varying percentage values from 40% to 80%.
Add to Wishlist
Download
AI Customize
A slide featuring four bar graphs labeled A, B, C, and D with caption areas underneath, connected by dotted arrows.
Free
Add to Wishlist
Download
AI Customize
Chevron graph template with four percentage columns and captions below each bar.
Add to Wishlist
Download
AI Customize
Kano Customer Model chart slide showing the categories Delighters, Basic, and Satisfiers with labeled arrows.
Add to Wishlist
Download
AI Customize
Kano model with a red arrow and orange, red, and green zones for user satisfaction placed in a white background.
Add to Wishlist
Download
AI Customize
Circular segmented graph showing percentages from 52% to 80% in green and blue tones, with text captions on the right.
Add to Wishlist
Download
AI Customize
Best Graph Business Growth PowerPoint Template Slide
Add to Wishlist
Download
AI Customize
Graph illustrating the Endowment Effect, showing value versus outcome with gains and losses marked.
Add to Wishlist
Download
AI Customize
Graphics PowerPoint slide featuring five vertical progress bars with different percentages and icons with captions.
Add to Wishlist
Download
AI Customize
Story plot diagram with beginning, middle, and end sections in pastel colors, connected by icons on a line graph.
Add to Wishlist
Download
AI Customize
Layered area chart with red and green segments, numeric axes, and two icons below with captions on a white background.
Add to Wishlist
Download
AI Customize
Infographic PowerPoint slide with four blue bars of increasing height, each associated with a caption and placeholder text.
Add to Wishlist
Download
AI Customize
Slide showing a gray-shaded area graph with red circular markers and captions for three highlighted years.
Add to Wishlist
Download
AI Customize
Graph illustrating the yearly findings of how to find PowerPoint templates from 2016 to 2023 with two data series.
Free
Add to Wishlist
Download
AI Customize
Slide with green radar chart, satellite dish on the right, and two labeled statistical hexagonal sections below.
Add to Wishlist
Download
AI Customize
Line graph representing the Kubler Ross Model with seven emotional stages marked by colored points on a curve.
Free
Add to Wishlist
Download
AI Customize
Weekly bar chart with green bars showing Style 1 to Style 4 timelines, accompanied by a tilted yellow note box.
Add to Wishlist
Download
AI Customize
Line graph displaying trends across four categories with three distinct colored lines and percentage highlights below.
Add to Wishlist
Download
AI Customize
PowerPoint slide showing a quick fact about music's impact, with a graph displaying intelligence levels and famous composers.
Add to Wishlist
Download
AI Customize
PowerPoint template showing a line graph with three products A, B, and C plotted over time from 2015 to 2019.
Free
Add to Wishlist
Download
AI Customize
Slide with a sloping bar graph in green and gray segments, three numbered points, and a text box on the right.
Add to Wishlist
Download
AI Customize
Two vertical bar charts with three columns each, alongside captions with percentages in varying shades of orange.
Free
Add to Wishlist
Download
AI Customize
Revenue analysis slide with bar chart, financial icon, and two descriptive sections for customer metrics.
Free
Add to Wishlist
Download
AI Customize
3D bar graph with six green bars of varying heights, labeled placeholders, and a gray sidebar with text blocks.
Free
Add to Wishlist
Download
AI Customize
Visual layout of various charts, including area and bar graphs, arranged in a grid format with caption areas.
Free
Add to Wishlist
Download
AI Customize
Comparison of revenue and cost distributions with pie charts displaying CAPEX and OPEX percentages.
Add to Wishlist
Download
AI Customize
Slide showing a graph of the Dunning-Kruger Effect with stages from knowing nothing to becoming an expert with a title text.
Add to Wishlist
Download
AI Customize
Narrative arc slide displaying key plot stages with placeholder text areas.
Add to Wishlist
Download
AI Customize
Line graph slide with two data series in red and yellow, showing item based data fluctuations and a text caption.