Dunning Kruger Effect PPT Templates & Google Slides

Slide showing a graph of the Dunning-Kruger Effect with stages from knowing nothing to becoming an expert with a title text.
P.ID : 59248
    903 views
    66 Downloads
    Get Custom Slides by Experts
    Instantly Access Templates in PowerPoint

    Ten Noded Dunning Kruger Effect Graph Slide

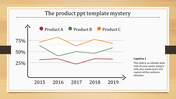
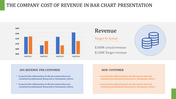
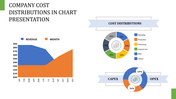
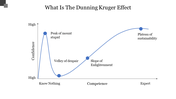
    What Is The Dunning Kruger Effect PowerPoint Template? This template will help you explain the Dunning Kruger Effect concept in a clear and concise manner. It helps to emphasize the alignment phase and the illusion of competence that occurs when learning a new skill or knowledge area. You can customize this layout according to your needs.

    What Is The Dunning Kruger Effect PowerPoint Template? This template has a simple design, includes the four nodes of the psyche. It has a curved graph that explains how people lose confidence due to their lack of experience or knowledge. It also shows how a cognitive bias changes with age. It is a powerful way to show this important principle in an engaging graph PPT presentation.

    Features of this template:

    1. 100% customizable slides and easy to download.
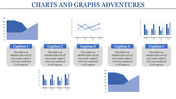
    2. Slides available in different nodes & colors.
    3. The slide contained 16:9 and 4:3 format.
    4. Easy to change the slide colors quickly.
    5. Well-crafted template with instant download facility.
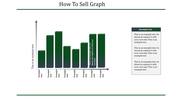
    6. It has a simple layout with a graph.
    Advertisement

    You May Also Like These PowerPoint Templates

    Add to Wishlist
    Download
    AI Customize
    An S shaped curve graph with three key points, illustrating growth or change over time with captions.
    Add to Wishlist
    Download
    AI Customize
    Positively skewed histogram with blue bars, three highlighted data points, and a centered orange button at the bottom.
    Add to Wishlist
    Download
    AI Customize
    A bell curve chart slide with an orange shaded area representing percentages for standard deviations.
    Add to Wishlist
    Download
    AI Customize
    A four quadrant graph with colorful sections labeled from 01 to 04 in the center. Each quadrant has placeholder text area.
    Add to Wishlist
    Download
    AI Customize
    Graph representation of the Dunning Kruger effect, mapping confidence levels from know nothing to expert across four stages.
    Add to Wishlist
    Download
    AI Customize
    Editable Kano Model PowerPoint and Google Slides Themes
    Add to Wishlist
    Download
    AI Customize
    Bradley curve chart with four sections in shades of maroon, and orange, illustrating progression through stages.
    Add to Wishlist
    Download
    AI Customize
    A chart with a bell curve divided into five colored sections illustrating market segments with percentages.
    Add to Wishlist
    Download
    AI Customize
    Graphical representation of a story arc showing stages from exposition to resolution, with labeled points for each action.
    Add to Wishlist
    Download
    AI Customize
    Collection of plot diagram templates showing rising action, climax, and resolution in a line graph style.
    Add to Wishlist
    Download
    AI Customize
    Line graph template with two lines showing data across seven items, with percentage icons and captions below.
    Add to Wishlist
    Download
    AI Customize
    Conflict management slide with a slope line graph marking stages in four colored arrows, ending in a yellow star.
    Add to Wishlist
    Download
    AI Customize
    Spider graph displaying data from 2018 to 2023 with two data sets highlighted in orange and pink lines.
    Add to Wishlist
    Download
    AI Customize
    Slide deck showing the Kubler Ross change curve with colorful dots on a line graph illustrating emotional stages over time.
    Add to Wishlist
    Download
    AI Customize
    Perceptual map slide showcasing product placement across geographical regions Europe, Asia, and Africa in colored boxes.
    Add to Wishlist
    Download
    AI Customize
    Graph showing a positively skewed distribution, with a longer tail extending to the right, indicating more high values.
    Add to Wishlist
    Download
    AI Customize
    Kano model analysis graph illustrating delighters, satisfiers, and basic features with curved lines and caption areas.