Data Chart Template PowerPoint Presentation For You

Slide with a stacked area chart in shades of pink, green, and yellow, and three matching circular data labels on the right.
P.ID : 47641
    226 views
    24 Downloads
    Get Custom Slides by Experts
    Instantly Access Templates in PowerPoint

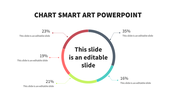
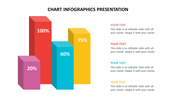
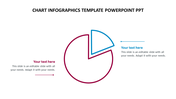
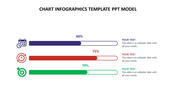
    New Data Chart Design 

    What to make a data chart template that can give an impressive impression on the presentation. Then why don't you try downloading this explicit template that can make your presentation look even more attractive? 

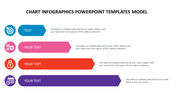
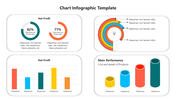
    The template is exclusive with a new and fantastic design that can be edited using this fully customized template. This graph design gives clear-cut information on the topic at your graphing using this template. 

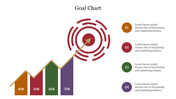
    The template is user-friendly that can make three nodes given with an explicit template. The template is 100% satisfactory, which can give an eye-catchy slide to the audience. Why don't you try downloading the explicit data chart PPT template and giving incredible information on your topic? Try now!.

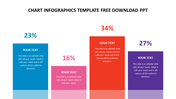
    Features of this template :

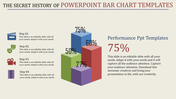
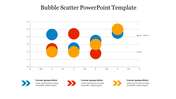
    • It is 100% customizable and straightforward to download.
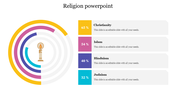
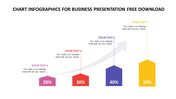
    • The Slides are available in different nodes & colors.
    • The slide contained 16:9 and 4:3 format.
    • It is easy to change the slide colors quickly.
    • It is a well-crafted template with an instant download facility.
    Advertisement

    You May Also Like These PowerPoint Templates

    Add to Wishlist
    Download
    AI Customize
    SWOT chart PPT template with four categories each with corresponding color coded icons and percentages on a white backdrop.
    Add to Wishlist
    Download
    AI Customize
    Infographic slide with two colorful line charts from 2016 to 2019, on a blurred background of a tablet displaying data.
    Add to Wishlist
    Download
    AI Customize
    Download Unlimited Chart Template Presentation
    Add to Wishlist
    Download
    AI Customize
    Four distinct lines in blue, red, orange, and green on a line graph, with corresponding numbered captions beside.
    Add to Wishlist
    Download
    AI Customize
    Creative Asset Turnover PowerPoint Presentation PPT Slide
    Add to Wishlist
    Download
    AI Customize
    Line chart showcasing trends for two designs, labeled design 01 and 02, from 2015 to 2019.
    Add to Wishlist
    Download
    AI Customize
    A chart presentation slide with four circular progress indicators showing different percentages and corresponding captions.
    Add to Wishlist
    Download
    AI Customize
    Infographic showing four vertical 3D bars in different colors, each representing percentages with placeholder text area.
    Free
    Add to Wishlist
    Download
    AI Customize
    Data visualization slide showcasing an orange and black bubble chart with labeled axes and a text block on the side.
    Free
    Add to Wishlist
    Download
    AI Customize
    Wave shaped chart on a dark blue background with a detailed caption and numerical labels across the curve.
    Add to Wishlist
    Download
    AI Customize
    Horizontal bar chart with four colored bars in red, blue, purple, and pink, each labeled with a numerical value.
    Add to Wishlist
    Download
    AI Customize
    Slide showing a gray-shaded area graph with red circular markers and captions for three highlighted years.
    Add to Wishlist
    Download
    AI Customize
    Infographic PowerPoint slide with four blue bars of increasing height, each associated with a caption and placeholder text.
    Add to Wishlist
    Download
    AI Customize
    Circle chart PPT template displaying percentages in four sections with vibrant colors on a white backdrop with captions.
    Add to Wishlist
    Download
    AI Customize
    Colorful pie chart PPT template with four segments showing percentages and corresponding descriptions on the right.
    Add to Wishlist
    Download
    AI Customize
    Business PowerPoint slide displaying colorful pie charts with percent values, with text fields on a white backdrop.
    Free
    Add to Wishlist
    Download
    AI Customize
    Color coded bar chart layout with sections in red, green, purple, and blue, each with labels and a central icon.
    Add to Wishlist
    Download
    AI Customize
    Business growth infographic with orange segments, diagonal growth line, and labeled stages of organizational development.
    Add to Wishlist
    Download
    AI Customize
    Business template bar graph with stacked segments for three captions, showing percentages per month from January to December.