Chart Templates PPT Donut Model PowerPoint Presentation

Donut chart with alternating blue and black segments, labeled with percentages, and four icon based text boxes on the right.
P.ID : 38448
    184 views
    21 Downloads
    Get Custom Slides by Experts
    Instantly Access Templates in PowerPoint

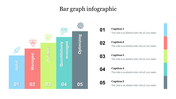
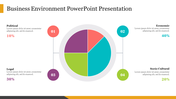
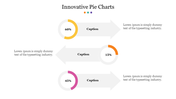
    Chart Presentation Slide

    Chart presentation is a powerful tool that visualizes demographic data. You can also make the conversation more engaging and memorable. It is useful when comparing data about your company on a percentage basis. You can use this to present the share market distribution, budget allocations, and survey results. You can apply it to compare the proportions of different categories in various fields. This radiant template looks like a pie or a donut, and each part represents a slice. Would you like to give a visual treat to your audience? Then, try this template and make it more crispy!


    Features of the template:

    • 100% customizable slides and easy to download.
    • The slide contains 16:9 and 4:3 formats.
    • Highly Compatible with PowerPoint and Google Slides.
    • This slide has a colorful design pattern.
    • Easy to change the slide's colors
    Advertisement

    You May Also Like These PowerPoint Templates

    Add to Wishlist
    Download
    AI Customize
    Slide with three bar charts, a pie chart, and arrow graphics in vibrant colors for data visualization.
    Free
    Add to Wishlist
    Download
    AI Customize
    Preventive maintenance PowerPoint slide with purple mountain peaks from maintenance to system, with icons below each.
    Add to Wishlist
    Download
    AI Customize
    Multicolored mekko chart displaying data for five topics, with percentages and totals in a blue column on the right.
    Add to Wishlist
    Download
    AI Customize
    Seven-segment radial chart in various colors, labeled 1 to 7, with editable text descriptions surrounding the chart.
    Add to Wishlist
    Download
    AI Customize
    Slide displaying a percentage model with four color coded sections representing various percentages with placeholder text.
    Add to Wishlist
    Download
    AI Customize
    Quad chart template with four colorful sections labeled from one to four, each with an icon, and corresponding text area.
    Add to Wishlist
    Download
    AI Customize
    Cockpit charts slide showing a donut chart with three data points and a global map with gender distribution.
    Add to Wishlist
    Download
    AI Customize
    Radial chart with four concentric arcs labeled 30%, 40%, 70%, and 100%, connected to icons and caption areas.
    Free
    Add to Wishlist
    Download
    AI Customize
    Orange and black cylindrical bars in a 3D chart design placed on a gray base with descriptive captions.
    Add to Wishlist
    Download
    AI Customize
    Slide illustrating a goal chart with an arrow pointing at a target and four colored bars showing percentage milestones.
    Add to Wishlist
    Download
    AI Customize
    Concentric circle chart with bold colors, and a central candle icon with corresponding religion labels and percentages.
    Free
    Add to Wishlist
    Download
    AI Customize
    Four colorful 3D bars in varying heights and percentages, alongside icons and descriptions on a beige background.
    Add to Wishlist
    Download
    AI Customize
    Colorful 3D bar chart with pink, red, blue, and yellow bars, each labeled with percentages.
    Free
    Add to Wishlist
    Download
    AI Customize
    Infographic PowerPoint slide with three bar charts showing weekly data with percentages for each day of the week.
    Add to Wishlist
    Download
    AI Customize
    Donut chart with alternating blue and black segments, labeled with percentages, and four icon based text boxes on the right.
    Add to Wishlist
    Download
    AI Customize
    Four 3D cone charts in red, blue, teal, and green with icons at the top, and labeled for different metrics.
    Add to Wishlist
    Download
    AI Customize
    PowerPoint slide featuring a circular chart infographic with sections for text.
    Add to Wishlist
    Download
    AI Customize
    Chart with four colored bars, each featuring an icon on the left and space for text, arranged in a vertical sequence.