Best Template Chart Infographics PowerPoint Presentations

Colorful bar chart with five vertical bars in ascending order, each labeled with positive values and curved line above.
P.ID : 50024
    246 views
    32 Downloads
    Get Custom Slides by Experts
    Instantly Access Templates in PowerPoint

    Colorful Infographic PowerPoint Presentation

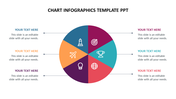
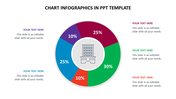
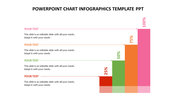
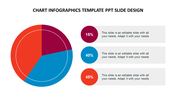
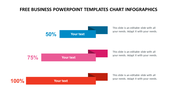
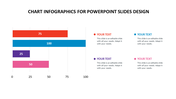
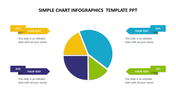
    Do you have a proposal for using PPT infographics in business? The template you have chosen is the best one for you. You may display complex information clearly and concisely in a way that is simple to understand by using these five vibrant bookmark arrow model designs. Pre-made and embedded data-driven charts allow you to customize your data. Now try!

    Features of the template

    •  100% customizable slides and easy to download.
    •  Slides are available in different nodes & colors.
    •  The slide contained 16:9 and 4:3 formats.
    •  Easy to change the slide colors quickly.
    •  Well-designed template with instant download facility.
    • It has a clean image of a colorful design PPT.
    Advertisement

    You May Also Like These PowerPoint Templates

    Add to Wishlist
    Download
    AI Customize
    Spider web template featuring a multi-colored radar chart in the center with four labeled icon sections at the corners.
    Add to Wishlist
    Download
    AI Customize
    Spider web diagram with two data points represented in orange and black, and two caption boxes on the left.
    Add to Wishlist
    Download
    AI Customize
    Quad chart with four colorful triangular sections labeled 01, 02, 03, and 04, each with placeholder text boxes on the sides.
    Add to Wishlist
    Download
    AI Customize
    Three-part pie chart infographic with colored segments, arrows pointing to text placeholders, and varied percentage values.
    Add to Wishlist
    Download
    AI Customize
    Spider web diagram with two datasets in contrasting colors, showing values for five dates with caption areas.
    Add to Wishlist
    Download
    AI Customize
    Practical Metric Chart PowerPoint Presentation Template
    Add to Wishlist
    Download
    AI Customize
    Combination of a horizontal bar chart and a vertical red bars on the right, with three percentage circles at the bottom.
    Free
    Add to Wishlist
    Download
    AI Customize
    Colorful 3D bar chart infographic with varying percentages with placeholder text.
    Add to Wishlist
    Download
    AI Customize
    Chart infographic with a world map marked with colored pins, a donut chart, and a bar graph with a caption area.
    Add to Wishlist
    Download
    AI Customize
    Slide with three bar charts, a pie chart, and arrow graphics in vibrant colors for data visualization.
    Free
    Add to Wishlist
    Download
    AI Customize
    Preventive maintenance PowerPoint slide with purple mountain peaks from maintenance to system, with icons below each.
    Add to Wishlist
    Download
    AI Customize
    Multicolored mekko chart displaying data for five topics, with percentages and totals in a blue column on the right.
    Add to Wishlist
    Download
    AI Customize
    Seven-segment radial chart in various colors, labeled 1 to 7, with editable text descriptions surrounding the chart.
    Add to Wishlist
    Download
    AI Customize
    Color coded team schedule with horizontal bars representing tasks across days of the week, labeled by name.
    Add to Wishlist
    Download
    AI Customize
    Slide displaying a percentage model with four color coded sections representing various percentages with placeholder text.
    Add to Wishlist
    Download
    AI Customize
    Quad chart template with four colorful sections labeled from one to four, each with an icon, and corresponding text area.
    Add to Wishlist
    Download
    AI Customize
    Cockpit charts slide showing a donut chart with three data points and a global map with gender distribution.
    Add to Wishlist
    Download
    AI Customize
    Radial chart with four concentric arcs labeled 30%, 40%, 70%, and 100%, connected to icons and caption areas.
    Free
    Add to Wishlist
    Download
    AI Customize
    Orange and black cylindrical bars in a 3D chart design placed on a gray base with descriptive captions.