PowerPoint Chart Infographics Template PPT Slide Designs

Infographic with a four level bar chart in red, green, orange, and pink, paired with percentage labels and text boxes.
P.ID : 49718
    16 slides
    Boost Engagement Rate PowerPoint and Google Slides Themes
    18 slides
    Chart template featuring a cover slide deck with a glowing stock market bar chart and multiple infographic slides.
    21 slides
    Infographics Charts PowerPoint And Google Slides Themes
    163 views
    15 Downloads
    Get Custom Slides by Experts
    Instantly Access Templates in PowerPoint

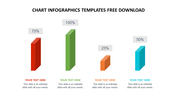
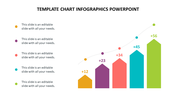
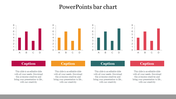
    Bar Chart Infographic Slide 

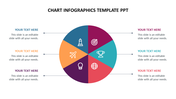
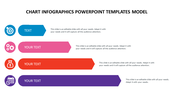
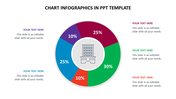
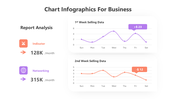
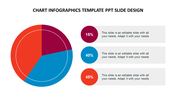
    It's easy to represent all your data innovatively using chart infographics. We, SlideEgg, offer various chart slides for business, sales, marketing, meeting conferences, etc. Make use of these chart infographics to show your data brightly. It will save time and allow you to do your presentation more quickly. This bar chart helps you show your data independently. This bar diagram is easy, and collectively, you can represent data. The bars are colored differently to make the listeners more attentive to the data. You can add text on the left side and add percentage values neatly. You can also add captions in color and can personalize this slide of your own instantly on MS PowerPoint and Google Slides. Grab Now!!!

    Features of the template

    • 100% customizable slides and easy to download.
    • Slides are available in different nodes & colors.
    • The slide contains 16:9 and 4:3 formats.
    • Easy to change the colors of the slide quickly.
    • Well-crafted template with instant download facility.
    • Lightning fast editable Bar chart presentation guaranteed.
    Advertisement

    You May Also Like These PowerPoint Templates

    Add to Wishlist
    Download
    AI Customize
    Slide with a circular pie chart showing data distribution in red, green, orange,  blue, and purple, with text around it.
    Add to Wishlist
    Download
    AI Customize
    A PowerPoint layout featuring five captioned text sections alongside a colorful pie chart with placeholder text.
    Add to Wishlist
    Download
    AI Customize
    PowerPoint slide with colorful bar chart infographic representing different percentages on a white backdrop.
    Add to Wishlist
    Download
    AI Customize
    Chart infographics with a variety of chart including pie chart, bar charts, line graphs, and area charts with a caption area.
    Free
    Add to Wishlist
    Download
    AI Customize
    Free PPT Template Presentation designs and Google Slides
    Add to Wishlist
    Download
    AI Customize
    A pie chart template with three colored sections labeled 01, 02, and 03, each with matching captions.
    Free
    Add to Wishlist
    Download
    AI Customize
    Amazing Chart Infographics PPT Template Free Download
    Add to Wishlist
    Download
    AI Customize
    Business slide with three pie charts in teal, green, and red showing percentages and captions below.
    Free
    Add to Wishlist
    Download
    AI Customize
    3D stacked bar chart with four vertical bars in yellow, orange, red, and pink, each labeled with numbers and text around it.
    Add to Wishlist
    Download
    AI Customize
    Three-section pie chart featuring color-coded segments: 10% orange, 15% green, and 75% red, annotated with caption areas.
    Free
    Add to Wishlist
    Download
    AI Customize
    Four percentage-based circular charts showing various progress levels, with placeholder text under each chart.
    Add to Wishlist
    Download
    AI Customize
    Circular flow chart design featuring five colored segments connected to titles, centered around a gray camera icon.
    Add to Wishlist
    Download
    AI Customize
    Best Milestone Chart PowerPoint Presentation Template
    Free
    Add to Wishlist
    Download
    AI Customize
    3D pie chart slide showing five colored segments with percentages each labeled with placeholder text.
    Add to Wishlist
    Download
    AI Customize
    A slide showing four colorful triangles labeled with percentages representing effect, planning, execution, and hard work.
    Add to Wishlist
    Download
    AI Customize
    Progress bar template with three steps, indicating the completion status for each step using green, blue, and red colors.
    Add to Wishlist
    Download
    AI Customize
    A slide with a progress bar at 50% completion with multicolored segments and caption areas in a white backdrop with a title.
    Add to Wishlist
    Download
    AI Customize
    PowerPoint Bubble Chart Presentation and Google Slides