Affordable Chart Infographics Presentation Template

Colorful 3D bar chart with pink, red, blue, and yellow bars, each labeled with percentages.
P.ID : 50027
    420 views
    86 Downloads
    Get Custom Slides by Experts
    Instantly Access Templates in PowerPoint

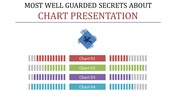
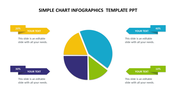
    Neat chart infographics template


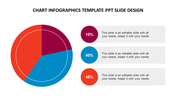
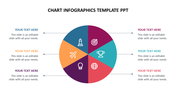
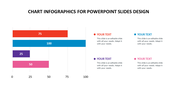
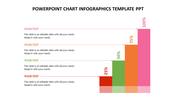
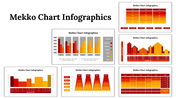
    Download this chart infographics PPT template for your exclusive presentation. This template is creative with a bar graph design that can make the presentation effective. The template is effective with percentage levels and makes the explanation effective. The template is impressive, with multiple colors that can do business understanding in four nodes. This template is fully customized and so editing this template can make the presentation even more eye-catchy. Try now!. 

    Feature of the Template
    • 100% customizable slides
    • Easy to change the slide colors quickly.
    • It is easy to download.
    • Slides are available in different nodes & colors.
    • The slide contained 16:9 and 4:3 formats.
    • Well-crafted template with instant download facility.
    • Creative design with text area.
    Advertisement

    You May Also Like These PowerPoint Templates

    Add to Wishlist
    Download
    AI Customize
    KWL slide deck with various layouts, using purple, orange, and red, illustrating the learning process in a structured format.
    Free
    Add to Wishlist
    Download
    AI Customize
    PPT Chart Infographics Free Download Design Slides
    Add to Wishlist
    Download
    AI Customize
    Colorful bar chart with five vertical bars in ascending order, each labeled with positive values and curved line above.
    Add to Wishlist
    Download
    AI Customize
    Slide with a stacked area chart in shades of pink, green, and yellow, and three matching circular data labels on the right.
    Add to Wishlist
    Download
    AI Customize
    Triangular chart with overlapping colored sections labeled 30% to 100%, each linked to captions areas below.
    Add to Wishlist
    Download
    AI Customize
    Best Business PowerPoint Chart Infographics Slide
    Add to Wishlist
    Download
    AI Customize
    Four colored bar charts in red, yellow, green, and orange, each with captions below, displayed on a white background.
    Free
    Add to Wishlist
    Download
    AI Customize
    Donut chart template with four segments representing different quarters with placeholder text.
    Free
    Add to Wishlist
    Download
    AI Customize
    Gantt chart with green horizontal bars representing tasks and percentages, spanning from January to December 2019.
    Add to Wishlist
    Download
    AI Customize
    3D bar chart with four colorful stacked columns in orange, blue, red, and green, each labeled with a percentage value.
    Add to Wishlist
    Download
    AI Customize
    Boost Engagement Rate PowerPoint and Google Slides Themes
    Add to Wishlist
    Download
    AI Customize
    Chart visualization slide with a circular pie chart and a horizontal bar graph for team member progress on tasks.
    Free
    Add to Wishlist
    Download
    AI Customize
    Attractive PowerPoint Templates Chart Infographics Design
    Add to Wishlist
    Download
    AI Customize
    Bar chart showing percentages from 2017 to 2021, with bars in blue, green, orange, red, and pink, and a woman illustration.
    Free
    Add to Wishlist
    Download
    AI Customize
    Business infographic PPT chart with colorful horizontal bar segments with placeholder text on a white backdrop.
    Add to Wishlist
    Download
    AI Customize
    Colorful chart infographic featuring pie charts, bar graphs, and a circular diagram with percentage values.
    Add to Wishlist
    Download
    AI Customize
    Chart template featuring a cover slide deck with a glowing stock market bar chart and multiple infographic slides.
    Add to Wishlist
    Download
    AI Customize
    Colorful chart infographic PPT slide with various percentage values displayed in horizontal bars with placeholder text.