PPT Chart Infographics Design For Powerful Presentation

Colorful chart infographic PPT slide with various percentage values displayed in horizontal bars with placeholder text.
P.ID : 50014
    438 views
    74 Downloads
    Get Custom Slides by Experts
    Instantly Access Templates in PowerPoint

    Best Chart Infographics Design Template

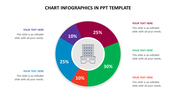
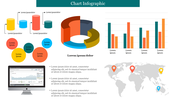
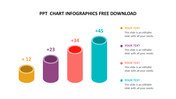
    Infographics are a fantastic tool for presenting data visually and attracting audience interest. The templates work with PowerPoint and are ideal for modern infographic presentations. Six-noded PPT can help relate to project management. It has typeface and text placeholders that are simple to alter and are included with the multi-color square designs. Try using this slide to transport your audience to a surreal setting.

    Features of the template

    •  100% customizable slides and easy to download.
    •  Slides are available in different nodes & colors.
    •  The slide contained 16:9 and 4:3 formats.
    •  Easy to change the slide colors quickly.
    •  Well-designed template with instant download facility.
    • It has a clean image of a colorful design PPT.
    Advertisement

    You May Also Like These PowerPoint Templates

    Free
    Add to Wishlist
    Download
    AI Customize
    3D pie chart template with colorful segments and text placeholders, with a personal figure pointing at the chart.
    Add to Wishlist
    Download
    AI Customize
    Progress bar template with three steps, indicating the completion status for each step using green, blue, and red colors.
    Add to Wishlist
    Download
    AI Customize
    A slide with a progress bar at 50% completion with multicolored segments and caption areas in a white backdrop with a title.
    Add to Wishlist
    Download
    AI Customize
    PowerPoint Bubble Chart Presentation and Google Slides
    Add to Wishlist
    Download
    AI Customize
    Colorful bar graph infographic slide representing five levels of process maturity, each labeled and iconified with captions.
    Free
    Add to Wishlist
    Download
    AI Customize
    Circular pie chart divided into six color coded sections with percentages, and corresponding numbered captions on both sides.
    Add to Wishlist
    Download
    AI Customize
    Diffusion model graph divided into two segments and split into colorful sections and arrows indicating transitions.
    Add to Wishlist
    Download
    AI Customize
    Five donut shaped progress indicators in various colors with percentage, each with numbered text areas.
    Add to Wishlist
    Download
    AI Customize
    Line graph showing the dunning-kruger effect with peaks and valleys labeled as confidence and competence grow.
    Add to Wishlist
    Download
    AI Customize
    3D pie chart with blue, yellow, and red segments representing quarterly data, and corresponding captions on the right.
    Add to Wishlist
    Download
    AI Customize
    Best Business Environment PowerPoint Presentation Slide
    Add to Wishlist
    Download
    AI Customize
    Spider web template featuring a multi-colored radar chart in the center with four labeled icon sections at the corners.
    Add to Wishlist
    Download
    AI Customize
    Spider web diagram with two data points represented in orange and black, and two caption boxes on the left.
    Add to Wishlist
    Download
    AI Customize
    Quad chart with four colorful triangular sections labeled 01, 02, 03, and 04, each with placeholder text boxes on the sides.
    Add to Wishlist
    Download
    AI Customize
    Three-part pie chart infographic with colored segments, arrows pointing to text placeholders, and varied percentage values.
    Add to Wishlist
    Download
    AI Customize
    Spider web diagram with two datasets in contrasting colors, showing values for five dates with caption areas.