Check out stunning Spider Web Chart PowerPoint Slide


Creative Spider Web PPT Template
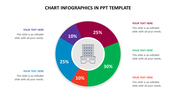
Download the Spider Web Chart PPT template for your explicit template. The template can make the best outcome using this template. The template is neat and designed with a spider web that can make the best presentation.
The template is fully customized and so editing this template is much easier. The template is given with three nodes that you can make the presentation look attractive. The template is used to show the interconnected factors in a business in a spider web.
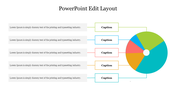
This template is creative and is added with user-friendly features that can surely gain the audience's attention. The template is added with a text area that you can add with the details of your topic.
Make edit that your download this explicit spider web template and gain success. You will be able to make them understand easily using this template. Download now!.
Features of the template:
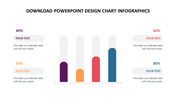
- Slides are available in different nodes & colors.
- Easy to change the slide colors.
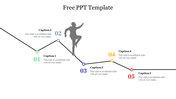
- Well-crafted template with instant download.
- 100 % customizable slides and easy to download.
- Well-crafted template with instant download.


You May Also Like These PowerPoint Templates


