PowerPoint Bubble Chart Presentation and Google Slides

Bubble Presentation Slide
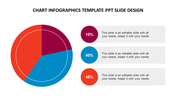
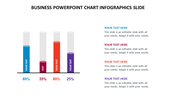
Visualize your data with our dynamic bubble chart. This versatile chart type presents data points as bubbles in a two-dimensional space, with the size and color of each bubble indicating additional dimensions. The trends and patterns will allow the audience to explore your data in depth. Use our bubble chart template to communicate complex information quickly and effectively. You can analyze market trends, track project milestones, or present survey results. Try it out now and see your data come to life!
Features of the template
- 100% customizable slides and easy to download.
- Slides are available in different nodes & colors.
- The slide contains 16:9 and 4:3 formats.
- Easy to change the colors of the slide quickly.
- Well-crafted template with an instant download facility.
- Highly compatible with PowerPoint and Google Slides.
- Top grade three-node featured template.
- Premium template with an elegant outlook.


You May Also Like These PowerPoint Templates
Add to Wishlist
Download
Edit

Add to Wishlist
Download
Edit

Add to Wishlist
Download
Edit


Add to Wishlist
Download
Edit

Add to Wishlist
Download
Edit


Add to Wishlist
Download
Edit

Add to Wishlist
Download
Edit

Add to Wishlist
Download
Edit

Add to Wishlist
Download

Add to Wishlist
Download
Edit


Add to Wishlist
Download
Edit

Add to Wishlist
Download
Edit

Add to Wishlist
Download
Edit

Add to Wishlist
Download
Edit


Add to Wishlist
Download
Edit
