Best Innovative PowerPoint Chart Templates presentation

Triangular chart with overlapping colored sections labeled 30% to 100%, each linked to captions areas below.
P.ID : 1193
    688 views
    34 Downloads
    Get Custom Slides by Experts
    Instantly Access Templates in PowerPoint

    Amazing PPT Chart Template 

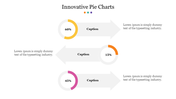
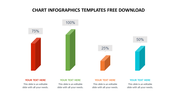
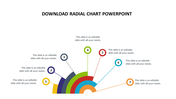
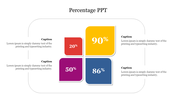
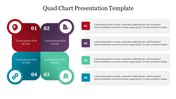
    ppt chart template is used in all types of professional business meetings. The template is unique and can be easily understood by the audience. The chart design template with arrows models with multiple colors that are lively and amazing. 

    The template is given with the percentage level of the product sale and other factors. Since this template is user-friendly and is fully customized, it is easier to edit and modify the text and nodes. In addition, the text area given at the bottom can make a clear presentation of the topic. 

    The audience will understand this five nodded template that is colorful, making an explicit template. Download this exclusive ppt chart template and make the audience attracted to this slide.
     

    Features of this template:

    • It is 100% customizable and straightforward to download.
    • The Slides are available in different nodes & colors.
    • The slide contained 16:9 and 4:3 format.
    • It is easy to change the slide colors quickly.
    • It is a well-crafted template with an instant download facility.
    • Arrow design with colorful nodes. 
    Advertisement

    You May Also Like These PowerPoint Templates

    Free
    Add to Wishlist
    Download
    AI Customize
    Orange and black cylindrical bars in a 3D chart design placed on a gray base with descriptive captions.
    Add to Wishlist
    Download
    AI Customize
    Slide illustrating a goal chart with an arrow pointing at a target and four colored bars showing percentage milestones.
    Add to Wishlist
    Download
    AI Customize
    Concentric circle chart with bold colors, and a central candle icon with corresponding religion labels and percentages.
    Free
    Add to Wishlist
    Download
    AI Customize
    Four colorful 3D bars in varying heights and percentages, alongside icons and descriptions on a beige background.
    Add to Wishlist
    Download
    AI Customize
    Colorful 3D bar chart with pink, red, blue, and yellow bars, each labeled with percentages.
    Free
    Add to Wishlist
    Download
    AI Customize
    Infographic PowerPoint slide with three bar charts showing weekly data with percentages for each day of the week.
    Add to Wishlist
    Download
    AI Customize
    Donut chart with alternating blue and black segments, labeled with percentages, and four icon based text boxes on the right.
    Add to Wishlist
    Download
    AI Customize
    Four 3D cone charts in red, blue, teal, and green with icons at the top, and labeled for different metrics.
    Add to Wishlist
    Download
    AI Customize
    PowerPoint slide featuring a circular chart infographic with sections for text.
    Add to Wishlist
    Download
    AI Customize
    Chart with four colored bars, each featuring an icon on the left and space for text, arranged in a vertical sequence.
    Add to Wishlist
    Download
    AI Customize
    Stunning Chart Infographics Template Free Download PPT
    Free
    Add to Wishlist
    Download
    AI Customize
    PowerPoint infographic with four colored pill shaped sections each labeled with placeholder text.
    Add to Wishlist
    Download
    AI Customize
    Chart infographic template with three progress bars in blue, red, and green accompanied by icons.
    Add to Wishlist
    Download
    AI Customize
    Chart infographic template with different chart types, including pie charts, bar charts, and a donut chart.
    Free
    Add to Wishlist
    Download
    AI Customize
    Infographic chart with four colorful blocks, each displaying a percentage, connected by a gray upward arrow.
    Add to Wishlist
    Download
    AI Customize
    Bubble Scatter PowerPoint Template With Three Nodes
    Add to Wishlist
    Download
    AI Customize
    SWOT chart PPT template with four categories each with corresponding color coded icons and percentages on a white backdrop.
    Add to Wishlist
    Download
    AI Customize
    Infographic slide with two colorful line charts from 2016 to 2019, on a blurred background of a tablet displaying data.