Free - Chart Infographics For Business Presentation Download

Free
Infographic chart with four colorful blocks, each displaying a percentage, connected by a gray upward arrow.
P.ID : 50033
    696 views
    347 Downloads
    Get Custom Slides by Experts
    Instantly Access Templates in PowerPoint

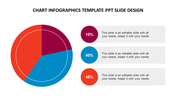
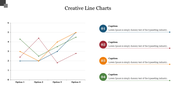
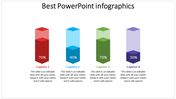
    Colorful Infographic PowerPoint Presentation

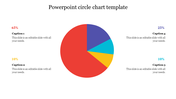
    Slides with infographics do a great job of bringing numbers to life. That's where PowerPoint infographics templates come in. They assist you in showing your audience the essential data. This editable and customized template provides you an advantage while sharing your thoughts and data. The Strategy Plan template's colorful tags and arrow marks can clearly show your company's growth. Trying this template will immediately provide you with all of its advantages.

    Features of the template

    •  100% customizable slides and easy to download.
    •  Slides are available in different nodes & colors.
    •  The slide contained 16:9 and 4:3 formats.
    •  Easy to change the slide colors quickly.
    •  Well-designed template with instant download facility.
    • It has a clean image of a colorful design PPT.
    Advertisement

    You May Also Like These PowerPoint Templates

    Add to Wishlist
    Download
    AI Customize
    Business growth infographic with orange segments, diagonal growth line, and labeled stages of organizational development.
    Add to Wishlist
    Download
    AI Customize
    Business template bar graph with stacked segments for three captions, showing percentages per month from January to December.
    Add to Wishlist
    Download
    AI Customize
    Infographic with a four level bar chart in red, green, orange, and pink, paired with percentage labels and text boxes.
    Add to Wishlist
    Download
    AI Customize
    Colorful bar chart PowerPoint slide showing percentage based growth from 25 to 100 percent with placeholder text.
    Add to Wishlist
    Download
    AI Customize
    Mekko chart slides in red and yellow gradients, showcasing various data visualizations with bars and stacked charts.
    Add to Wishlist
    Download
    AI Customize
    Chart template with data visualization in teal bars, quote section with large quotation mark, and percentage highlight.
    Add to Wishlist
    Download
    AI Customize
    Slide with five circular pie charts in orange, green, blue, gray, and red, arranged dynamically, displaying a percentage.
    Add to Wishlist
    Download
    AI Customize
    KWL slide deck with various layouts, using purple, orange, and red, illustrating the learning process in a structured format.
    Free
    Add to Wishlist
    Download
    AI Customize
    PPT Chart Infographics Free Download Design Slides
    Add to Wishlist
    Download
    AI Customize
    Colorful bar chart with five vertical bars in ascending order, each labeled with positive values and curved line above.
    Add to Wishlist
    Download
    AI Customize
    Slide with a stacked area chart in shades of pink, green, and yellow, and three matching circular data labels on the right.
    Add to Wishlist
    Download
    AI Customize
    Triangular chart with overlapping colored sections labeled 30% to 100%, each linked to captions areas below.
    Add to Wishlist
    Download
    AI Customize
    Best Business PowerPoint Chart Infographics Slide
    Add to Wishlist
    Download
    AI Customize
    Four colored bar charts in red, yellow, green, and orange, each with captions below, displayed on a white background.
    Free
    Add to Wishlist
    Download
    AI Customize
    Donut chart template with four segments representing different quarters with placeholder text.
    Free
    Add to Wishlist
    Download
    AI Customize
    Gantt chart with green horizontal bars representing tasks and percentages, spanning from January to December 2019.
    Add to Wishlist
    Download
    AI Customize
    3D bar chart with four colorful stacked columns in orange, blue, red, and green, each labeled with a percentage value.
    Add to Wishlist
    Download
    AI Customize
    Boost Engagement Rate PowerPoint and Google Slides Themes
    Add to Wishlist
    Download
    AI Customize
    Chart visualization slide with a circular pie chart and a horizontal bar graph for team member progress on tasks.