Best Infographic Chart Presentation Slide Template

Infographic slide with two colorful line charts from 2016 to 2019, on a blurred background of a tablet displaying data.
P.ID : 31715
    210 views
    3 Downloads
    Get Custom Slides by Experts
    Instantly Access Templates in PowerPoint

    Dynamic Infographic Chart Presentation Template


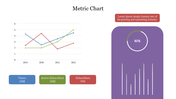
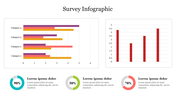
    The infographic chart presentation template and Google Slides themes offer a visually striking design for the delivery of data over time. 

    Slide Description:

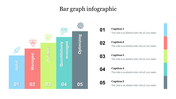
    This template comes with two infographic charts noting data from 2016 to 2019. Two charts are given, one presented with three colors and the other with five colored lines, giving a clear and engaging way to show the trends and changes.

    Who can benefit?

    This template is targeted at business analysts, educators, and marketers to help them in carrying across sometimes complex data in a very simple, yet captivating way. With colorful charts and a structured layout, it will capture the most critical data that needs to be taken across to the audience in a very visible and easy-to-understand manner, thereby improving understanding and retention.

    Download this template, and turn your data into dynamic visual displays right away.

    Features of the template


    • 100% customizable slides and easy to download.
    • The slides contain 16:9 and 4:3 formats.
    • Easy to change the colors quickly.
    • It is a well-crafted template with an instant download facility.
    • It is a 100% pre-designed slide.
    • The slide holds vibrant colors.
    Advertisement

    You May Also Like These PowerPoint Templates

    Add to Wishlist
    Download
    AI Customize
    Slide with three bar charts, a pie chart, and arrow graphics in vibrant colors for data visualization.
    Free
    Add to Wishlist
    Download
    AI Customize
    Preventive maintenance PowerPoint slide with purple mountain peaks from maintenance to system, with icons below each.
    Add to Wishlist
    Download
    AI Customize
    Multicolored mekko chart displaying data for five topics, with percentages and totals in a blue column on the right.
    Add to Wishlist
    Download
    AI Customize
    Seven-segment radial chart in various colors, labeled 1 to 7, with editable text descriptions surrounding the chart.
    Add to Wishlist
    Download
    AI Customize
    Slide displaying a percentage model with four color coded sections representing various percentages with placeholder text.
    Add to Wishlist
    Download
    AI Customize
    Quad chart template with four colorful sections labeled from one to four, each with an icon, and corresponding text area.
    Add to Wishlist
    Download
    AI Customize
    Cockpit charts slide showing a donut chart with three data points and a global map with gender distribution.
    Add to Wishlist
    Download
    AI Customize
    Radial chart with four concentric arcs labeled 30%, 40%, 70%, and 100%, connected to icons and caption areas.
    Free
    Add to Wishlist
    Download
    AI Customize
    Orange and black cylindrical bars in a 3D chart design placed on a gray base with descriptive captions.
    Add to Wishlist
    Download
    AI Customize
    Slide illustrating a goal chart with an arrow pointing at a target and four colored bars showing percentage milestones.
    Free
    Add to Wishlist
    Download
    AI Customize
    Four colorful 3D bars in varying heights and percentages, alongside icons and descriptions on a beige background.
    Add to Wishlist
    Download
    AI Customize
    Colorful 3D bar chart with pink, red, blue, and yellow bars, each labeled with percentages.
    Free
    Add to Wishlist
    Download
    AI Customize
    Infographic PowerPoint slide with three bar charts showing weekly data with percentages for each day of the week.
    Add to Wishlist
    Download
    AI Customize
    Donut chart with alternating blue and black segments, labeled with percentages, and four icon based text boxes on the right.
    Add to Wishlist
    Download
    AI Customize
    Four 3D cone charts in red, blue, teal, and green with icons at the top, and labeled for different metrics.
    Add to Wishlist
    Download
    AI Customize
    PowerPoint slide featuring a circular chart infographic with sections for text.
    Add to Wishlist
    Download
    AI Customize
    Chart with four colored bars, each featuring an icon on the left and space for text, arranged in a vertical sequence.
    Add to Wishlist
    Download
    AI Customize
    Stunning Chart Infographics Template Free Download PPT
    Add to Wishlist
    Download
    AI Customize
    Chart infographic template with three progress bars in blue, red, and green accompanied by icons.