Attractive Chart Smart Art PowerPoint Template Presentation

Smart chart with five colored segments labeled 16% to 35% and placeholder text placed in a white background.
P.ID : 38742
    104 views
    11 Downloads
    Get Custom Slides by Experts
    Instantly Access Templates in PowerPoint

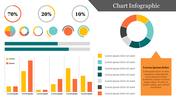
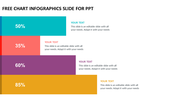
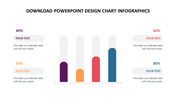
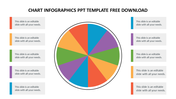
    Creative Chart Smart Template

    Categorize your precise facts about business and various themes using this chart smart art template. This potential template is filled with five nodes under a percentage. The high-resolution diagram that carries the nodes makes your work more special. Many experts download this template to preserve it for their forthcoming presentations as well. This template shares many instructive points about your topic in a clear manner. This template is an advantage to anyone who downloads it. So without any delay, download it from our website.

    Features of this template

    • 100% customizable slides and easy to download
    • Slides are available in different nodes & colors.
    • The slides contain 16:9 and 4:3 formats.
    • Easy to change the slide colors quickly.
    • Well-crafted template with an instant download facility.
    • Offered at an affordable cost.
    • Productive professional template.
    • Open on google slides.
    Advertisement

    You May Also Like These PowerPoint Templates

    Free
    Add to Wishlist
    Download
    AI Customize
    Four percentage-based circular charts showing various progress levels, with placeholder text under each chart.
    Add to Wishlist
    Download
    AI Customize
    Circular flow chart design featuring five colored segments connected to titles, centered around a gray camera icon.
    Add to Wishlist
    Download
    AI Customize
    Best Milestone Chart PowerPoint Presentation Template
    Free
    Add to Wishlist
    Download
    AI Customize
    3D pie chart slide showing five colored segments with percentages each labeled with placeholder text.
    Add to Wishlist
    Download
    AI Customize
    A slide showing four colorful triangles labeled with percentages representing effect, planning, execution, and hard work.
    Add to Wishlist
    Download
    AI Customize
    Progress bar template with three steps, indicating the completion status for each step using green, blue, and red colors.
    Add to Wishlist
    Download
    AI Customize
    A slide with a progress bar at 50% completion with multicolored segments and caption areas in a white backdrop with a title.
    Add to Wishlist
    Download
    AI Customize
    PowerPoint Bubble Chart Presentation and Google Slides
    Add to Wishlist
    Download
    AI Customize
    Colorful bar graph infographic slide representing five levels of process maturity, each labeled and iconified with captions.
    Add to Wishlist
    Download
    AI Customize
    Diffusion model graph divided into two segments and split into colorful sections and arrows indicating transitions.
    Add to Wishlist
    Download
    AI Customize
    Perceptual map slide showcasing product placement across geographical regions Europe, Asia, and Africa in colored boxes.
    Add to Wishlist
    Download
    AI Customize
    Five donut shaped progress indicators in various colors with percentage, each with numbered text areas.
    Add to Wishlist
    Download
    AI Customize
    Line graph showing the dunning-kruger effect with peaks and valleys labeled as confidence and competence grow.
    Add to Wishlist
    Download
    AI Customize
    Best Business Environment PowerPoint Presentation Slide
    Add to Wishlist
    Download
    AI Customize
    Spider web template featuring a multi-colored radar chart in the center with four labeled icon sections at the corners.