Elegant Quad Chart PowerPoint Presentation and Google Slides

Pack of 11 slides
P.ID : 55959
Advertisement
1.8K+ views
298 Downloads
Get Custom Slides by Experts
Instantly Access Templates in PowerPoint

Quad Chart Presentation Slides

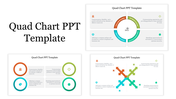
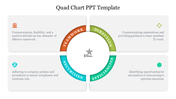
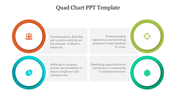
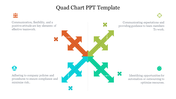
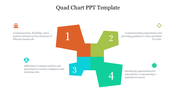
A Quad Chart is a four-part visual tool that is widely used in military, business, and academic settings to present complex information in a clear and concise manner. The four quadrants typically contain information on the topic or objective of the presentation, key metrics or data, challenges or obstacles, and potential solutions or strategies. Using a Quad Chart can help you to organize your ideas and present them effectively to your audience. It's important to keep the content simple, yet informative, and to use visual aids such as graphs or charts to support your points. Having a basic template in mind can help you to create a Quad Chart that is both professional and engaging.


Features of the template:

  • 100% customizable slides and easy to download.
  • Slides available in different nodes & colors.
  • The slide contained 16:9 and 4:3 format.
  • Easy to change the slide colors quickly.
  • Well-crafted template with instant download facility
  • Rectangular slide with colorful nodes.

You May Also Like These PowerPoint Templates

Add to Wishlist
Download
AI Customize
Bar chart showing percentages from 2017 to 2021, with bars in blue, green, orange, red, and pink, and a woman illustration.
Free
Add to Wishlist
Download
AI Customize
Business infographic PPT chart with colorful horizontal bar segments with placeholder text on a white backdrop.
Add to Wishlist
Download
AI Customize
Colorful chart infographic featuring pie charts, bar graphs, and a circular diagram with percentage values.
Add to Wishlist
Download
AI Customize
Chart template featuring a cover slide deck with a glowing stock market bar chart and multiple infographic slides.
Add to Wishlist
Download
AI Customize
Abstract PowerPoint template with four data points with icons and percentages with placeholder text.
Add to Wishlist
Download
AI Customize
Colorful chart infographic PPT slide with various percentage values displayed in horizontal bars with placeholder text.
Free
Add to Wishlist
Download
AI Customize
Structured chart with four stacked bars in blue, red, purple, and yellow, labeled with varying percentage values.
Free
Add to Wishlist
Download
AI Customize
Business growth slide with a 3D bar chart in multiple colors, trend lines, and descriptive text on the right side.
Add to Wishlist
Download
AI Customize
Infographics Charts PowerPoint And Google Slides Themes
Add to Wishlist
Download
AI Customize
Slide with a circular pie chart showing data distribution in red, green, orange,  blue, and purple, with text around it.
Add to Wishlist
Download
AI Customize
A PowerPoint layout featuring five captioned text sections alongside a colorful pie chart with placeholder text.
Add to Wishlist
Download
AI Customize
PowerPoint slide with colorful bar chart infographic representing different percentages on a white backdrop.
Add to Wishlist
Download
AI Customize
Chart infographics with a variety of chart including pie chart, bar charts, line graphs, and area charts with a caption area.
Free
Add to Wishlist
Download
AI Customize
Free PPT Template Presentation designs and Google Slides
Add to Wishlist
Download
AI Customize
An infographic slide featuring various charts and graphs, such as a pie chart, bar graphs, and maps, with placeholder text.
Add to Wishlist
Download
AI Customize
A pie chart template with three colored sections labeled 01, 02, and 03, each with matching captions.
Free
Add to Wishlist
Download
AI Customize
Amazing Chart Infographics PPT Template Free Download
Add to Wishlist
Download
AI Customize
chart infographics for business slide with weekly sales data graphs, stats for indicators and networking, and colorful icons.
Add to Wishlist
Download
AI Customize
Business slide with three pie charts in teal, green, and red showing percentages and captions below.
Free
Add to Wishlist
Download
AI Customize
Chart PPT slide with colored bars representing increases of 12, 23, 34, and 45, with text areas on a white backdrop.
Free
Add to Wishlist
Download
AI Customize
3D stacked bar chart with four vertical bars in yellow, orange, red, and pink, each labeled with numbers and text around it.
Add to Wishlist
Download
AI Customize
Three-section pie chart featuring color-coded segments: 10% orange, 15% green, and 75% red, annotated with caption areas.
Free
Add to Wishlist
Download
AI Customize
Four percentage-based circular charts showing various progress levels, with placeholder text under each chart.
Add to Wishlist
Download
AI Customize
Circular flow chart design featuring five colored segments connected to titles, centered around a gray camera icon.
Add to Wishlist
Download
AI Customize
Best Milestone Chart PowerPoint Presentation Template
Free
Add to Wishlist
Download
AI Customize
3D pie chart slide showing five colored segments with percentages each labeled with placeholder text.
Add to Wishlist
Download
AI Customize
A slide showing four colorful triangles labeled with percentages representing effect, planning, execution, and hard work.
Free
Add to Wishlist
Download
AI Customize
3D pie chart template with colorful segments and text placeholders, with a personal figure pointing at the chart.
Add to Wishlist
Download
AI Customize
Progress bar template with three steps, indicating the completion status for each step using green, blue, and red colors.
Add to Wishlist
Download
AI Customize
A slide with a progress bar at 50% completion with multicolored segments and caption areas in a white backdrop with a title.
Add to Wishlist
Download
AI Customize
PowerPoint Bubble Chart Presentation and Google Slides