Creative Spider Web Diagram PPT Template


Spider Web Diagram Presentation Slide
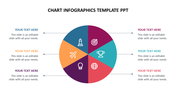
In the realm of visual communication, the spider web diagram emerges as a powerful concept, transcending traditional data representation by offering a dynamic way to showcase relationships, connections, and interdependencies between various elements. Much like a spider meticulously weaves its web, this diagram serves as a visual narrative tool, providing a comprehensive view of complex information. Its interconnected lines symbolize intricate relationships within a system, making it invaluable for presenting multifaceted concepts with clarity and precision. Its central hub unveils a network of branches, each representing a distinct data point, seamlessly interconnected to reveal profound insights. The vibrant palette and engaging icons further invigorate this template, making even complex data sets effortlessly comprehensible. Professionals, analysts, educators, and project managers can benefit from this PowerPoint template, which offers a user-friendly platform for effortlessly creating and customizing spider web diagrams. This 100% editable template proves instrumental in strategic planning, data analysis, and decision-making processes, providing presenters with the advantage of visually engaging their audience, simplifying complex ideas, and fostering a deeper understanding of intricate relationships.
Features of this template
- Slides are available in different nodes & colors.
- Easy to change the slide colors.
- Well-crafted template with instant download.
- 100 % customizable slides and easy to download.
- Well-crafted template with instant download.
- Two nodes with spider web design.


You May Also Like These PowerPoint Templates


