Attractive Business Growth Presentation Template and Google Slides

Red pinwheel infographic with four outward-pointing arrows displaying icons for presentation, documents, and charts.
P.ID : 29639
    399 views
    29 Downloads
    Get Custom Slides by Experts
    Instantly Access Templates in PowerPoint

    Attractive Business Growth Presentation Template and Google Slides


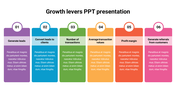
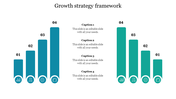
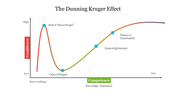
    Launching your Business Growth Presentation with a thought-provoking question sets the tone for engagement and insight. Our template, designed for Google Slides and PowerPoint, features a dynamic chart in a harmonious blue and white theme. 

    A slender line traverses the graph, illustrating the trajectory of business growth to potential clients and investors. Versatile in application, this template can be leveraged for a myriad of purposes, offering distinct sections for comprehensive exploration. With six differentiated parts, your presentation can address various facets of growth strategy, performance analysis, and market trends. 

    Spark curiosity, stimulate discussion, and empower your audience with actionable insights. Whether you're pitching a new venture, showcasing quarterly results, or outlining strategic initiatives, this template provides a visually compelling framework for conveying your message effectively. 

    Dive into the data, illuminate your findings, and chart the course for future success with our Business Growth Presentation template.

    Features of the template

    • 100% customizable slides and easy to download.
    • Slides are available in different nodes & colors.
    • The slide contains 16:9 and 4:3 formats.
    • It is easy to change the colors of the slide quickly. 
    • Well-crafted template with an instant download facility.
    Advertisement

    You May Also Like These PowerPoint Templates

    Add to Wishlist
    Download
    AI Customize
    Best Business Environment PowerPoint Presentation Slide
    Add to Wishlist
    Download
    AI Customize
    Spider web template featuring a multi-colored radar chart in the center with four labeled icon sections at the corners.
    Free
    Add to Wishlist
    Download
    AI Customize
    Growth hacking slide showing four colorful upward arrows with icons and four caption areas at the right.
    Add to Wishlist
    Download
    AI Customize
    Spider web diagram with two data points represented in orange and black, and two caption boxes on the left.
    Add to Wishlist
    Download
    AI Customize
    Quad chart with four colorful triangular sections labeled 01, 02, 03, and 04, each with placeholder text boxes on the sides.
    Add to Wishlist
    Download
    AI Customize
    Three-part pie chart infographic with colored segments, arrows pointing to text placeholders, and varied percentage values.
    Add to Wishlist
    Download
    AI Customize
    Spider web diagram with two datasets in contrasting colors, showing values for five dates with caption areas.
    Add to Wishlist
    Download
    AI Customize
    Practical Metric Chart PowerPoint Presentation Template
    Add to Wishlist
    Download
    AI Customize
    Infographic showing growth hacking techniques using four upward arrows, each representing strategies.
    Add to Wishlist
    Download
    AI Customize
    Slide with a colorful ascending line graph, featuring five circles with icons and text areas.
    Add to Wishlist
    Download
    AI Customize
    Combination of a horizontal bar chart and a vertical red bars on the right, with three percentage circles at the bottom.
    Add to Wishlist
    Download
    AI Customize
    Purple spiral funnel with eight levels, each labeled with a number and captions on a gradient background.
    Free
    Add to Wishlist
    Download
    AI Customize
    Timeline illustration with seven steps, each represented by a black and red circle featuring icons and year labels.
    Free
    Add to Wishlist
    Download
    AI Customize
    Colorful 3D bar chart infographic with varying percentages with placeholder text.
    Add to Wishlist
    Download
    AI Customize
    Chart infographic with a world map marked with colored pins, a donut chart, and a bar graph with a caption area.
    Add to Wishlist
    Download
    AI Customize
    Slide with three bar charts, a pie chart, and arrow graphics in vibrant colors for data visualization.
    Free
    Add to Wishlist
    Download
    AI Customize
    Preventive maintenance PowerPoint slide with purple mountain peaks from maintenance to system, with icons below each.
    Add to Wishlist
    Download
    AI Customize
    Multicolored mekko chart displaying data for five topics, with percentages and totals in a blue column on the right.
    Add to Wishlist
    Download
    AI Customize
    Color coded team schedule with horizontal bars representing tasks across days of the week, labeled by name.