Bass Diffusion Model PPT Template and Google Slides

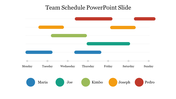
Five-Noded Bass Diffusion PPT Slide
Download this well-designed Bass Diffusion Model PowerPoint Template to create attractive visual presentations. It is a great way to get ideas on how to present information and images in your presentation. It helps you get creative while making your slides stand out from the rest. It also helps you come up with a presentation that will be visually appealing as well as easy to follow.
About the template:
The Bass Diffusion Model PowerPoint Template is well-designed with a realistic-looking chart. It has a multi-color graph, which clearly visualizes the early market and mainstream market. With this template, you can identify the newest things and whole product solutions to satisfy your customers needs. You can customize this template according to your requirements.
Features of this template:
1. 100% customizable slides and easy to download.
2. Slides available in different nodes & colors.
3. The slide contained 16:9 and 4:3 format.
4. Easy to change the slide colors quickly.
5. Well-crafted template with instant download facility.
6. An attractive slide with a multi-color graph.


You May Also Like These PowerPoint Templates
Add to Wishlist
Download
Edit

Add to Wishlist
Download
Edit

Add to Wishlist
Download
Edit

Add to Wishlist
Download
Edit


Add to Wishlist
Download
Edit

Add to Wishlist
Download
Edit


Add to Wishlist
Download
Edit

Add to Wishlist
Download
Edit

Add to Wishlist
Download
Edit

Add to Wishlist
Download
Edit

Add to Wishlist
Download
Edit

Add to Wishlist
Download
Edit

Add to Wishlist
Download
Edit

Add to Wishlist
Download
Edit

Add to Wishlist
Download
Edit

Add to Wishlist
Download
Edit


