Awesome Cockpit Charts PowerPoint Template Designs

 Canva
Canva
Get This Colorful Cockpit Themed Template:
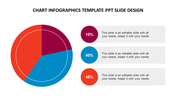
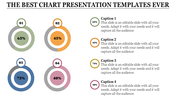
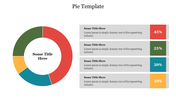
Look at this template with two nodes that clearly explain your discussed tropic through its diagrams. You can find that this template is filled with many attributes inside them, which uplifts the standard of the presentation. The two nodes have an elegant map, and a circular diagram depicts your theme with icons and percentages.
You can enter your desired points below the diagrams. The circuit diagram represents a pie chart that add more value to your slides. So, get this cockpit charts PowerPoint template and make potential presentation slides without any delay.
Features Of This Template:
- 100% customizable slides and easy to download
- Slides are available in different nodes & colors.
- The slides contained 16:9 and 4:3 format.
- Easy to change the slide colors quickly.
- Well-crafted Template with instant download facility.
- Crisp and elegant font style.
- The best Template with attractive nodes


You May Also Like These PowerPoint Templates
Add to Wishlist
Download

Add to Wishlist
Download
Edit

Add to Wishlist
Download
Edit

Add to Wishlist
Download
Edit

Add to Wishlist
Download

Add to Wishlist
Download
Edit

Add to Wishlist
Download
Edit

Add to Wishlist
Download
Edit


Add to Wishlist
Download
Edit

Add to Wishlist
Download
Edit

Add to Wishlist
Download
Edit

Add to Wishlist
Download
Edit

Add to Wishlist
Download
Edit

Add to Wishlist
Download
Edit


Add to Wishlist
Download
Edit

Add to Wishlist
Download
Edit

