Chart Visualization PowerPoint And Google Slides Template

Chart visualization slide with a circular pie chart and a horizontal bar graph for team member progress on tasks.
P.ID : 44849
    354 views
    65 Downloads
    Get Custom Slides by Experts
    Instantly Access Templates in PowerPoint

    Best Results PowerPoint Template


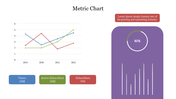
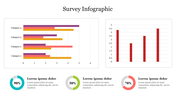
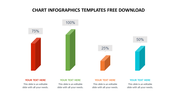
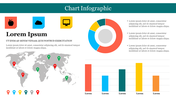
    Unlock the power of data presentation with our chart visualization template a dynamic tool designed to transform complex information into clear, visually appealing charts. Seamlessly blending functionality and aesthetics, this PowerPoint template offers an intuitive approach to displaying data. Perfect for professionals, educators, and students alike, this template caters to anyone looking to enhance their data presentation game. Whether you're delivering a business report or a classroom presentation, elevate your content with this versatile and customizable tool that simplifies the process of crafting visually appealing charts, saving users valuable time and ensuring their data is communicated effectively. Each chart is meticulously designed to balance aesthetics and functionality, providing a seamless experience for both creators and viewers. Enjoy the flexibility of customization with this fully editable slide-change colors, adjust fonts, and modify data points to suit your presentation style. Ideal for professionals in business, education, or any field requiring impactful data communication, this template caters to a diverse range of users seeking to enhance their presentations. Presenters gain a competitive edge by transforming complex data into visually engaging charts, enhancing audience understanding, fostering engagement, and leaving a lasting impression with the professional polish this template brings to your presentations. Empower your audience to elevate their presentations by recommending this template and sharing the secret to impactful data communication, setting the stage for visually compelling and memorable presentations.


    Features of this template


    • 100% customizable slides and easy to download.
    • The slide contains 16:9 and 4:3 formats.
    • Easy to change the colors of the slide quickly.
    • Highly compatible with PowerPoint and Google Slides.
    • Well-crafted template with an instant download facility.
    Advertisement

    You May Also Like These PowerPoint Templates

    Add to Wishlist
    Download
    AI Customize
    Seven-segment radial chart in various colors, labeled 1 to 7, with editable text descriptions surrounding the chart.
    Add to Wishlist
    Download
    AI Customize
    Color coded team schedule with horizontal bars representing tasks across days of the week, labeled by name.
    Add to Wishlist
    Download
    AI Customize
    Slide displaying a percentage model with four color coded sections representing various percentages with placeholder text.
    Add to Wishlist
    Download
    AI Customize
    Quad chart template with four colorful sections labeled from one to four, each with an icon, and corresponding text area.
    Add to Wishlist
    Download
    AI Customize
    Cockpit charts slide showing a donut chart with three data points and a global map with gender distribution.
    Add to Wishlist
    Download
    AI Customize
    Radial chart with four concentric arcs labeled 30%, 40%, 70%, and 100%, connected to icons and caption areas.
    Free
    Add to Wishlist
    Download
    AI Customize
    Orange and black cylindrical bars in a 3D chart design placed on a gray base with descriptive captions.
    Add to Wishlist
    Download
    AI Customize
    Slide illustrating a goal chart with an arrow pointing at a target and four colored bars showing percentage milestones.
    Free
    Add to Wishlist
    Download
    AI Customize
    Four colorful 3D bars in varying heights and percentages, alongside icons and descriptions on a beige background.
    Add to Wishlist
    Download
    AI Customize
    Colorful 3D bar chart with pink, red, blue, and yellow bars, each labeled with percentages.
    Free
    Add to Wishlist
    Download
    AI Customize
    Infographic PowerPoint slide with three bar charts showing weekly data with percentages for each day of the week.
    Add to Wishlist
    Download
    AI Customize
    Donut chart with alternating blue and black segments, labeled with percentages, and four icon based text boxes on the right.
    Add to Wishlist
    Download
    AI Customize
    Four 3D cone charts in red, blue, teal, and green with icons at the top, and labeled for different metrics.
    Add to Wishlist
    Download
    AI Customize
    PowerPoint slide featuring a circular chart infographic with sections for text.
    Add to Wishlist
    Download
    AI Customize
    Chart with four colored bars, each featuring an icon on the left and space for text, arranged in a vertical sequence.
    Add to Wishlist
    Download
    AI Customize
    Stunning Chart Infographics Template Free Download PPT
    Free
    Add to Wishlist
    Download
    AI Customize
    PowerPoint infographic with four colored pill shaped sections each labeled with placeholder text.
    Add to Wishlist
    Download
    AI Customize
    Chart infographic template with three progress bars in blue, red, and green accompanied by icons.
    Add to Wishlist
    Download
    AI Customize
    Chart infographic template with different chart types, including pie charts, bar charts, and a donut chart.