Download Chart Presentation Template and Google Slides

Chart template with data visualization in teal bars, quote section with large quotation mark, and percentage highlight.
P.ID : 33944
    265 views
    19 Downloads
    Get Custom Slides by Experts
    Instantly Access Templates in PowerPoint

    Visualize Success: Chart PowerPoint Template


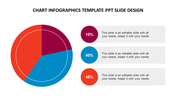
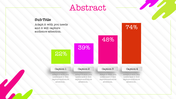
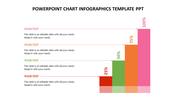
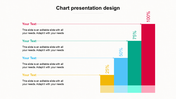
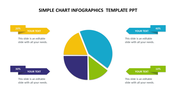
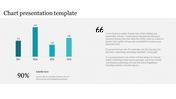
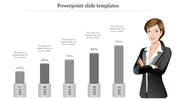
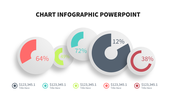
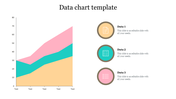
    Dive into the world of data visualization with our Chart Presentation Template and Google Slides Themes. This dynamic template features a sleek and modern chart with a percentage level indicator, accompanied by a spacious text area for detailed annotations. With its sophisticated blue theme, this template is perfect for professionals across industries, from finance and marketing to education and consulting. Whether you're delivering quarterly reports, outlining market trends, or analyzing performance metrics, our Chart Presentation Template empowers you to convey complex data with clarity and impact. Elevate your presentations and impress your audience with visually stunning charts that captivate attention and drive understanding. Download now and unlock the power of visual storytelling with our template.

    Features of the template


    • 100% customizable slides are easy to download.
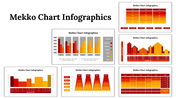
    • Slides are available in different colors.
    • The slide has 4:3 and 16:9 formats.
    • It is easy to change the slide colors quickly.
    • It has a cute design to impress an audience.
    • Create feature-rich, animated presentations.
    • This slide is available in both PowerPoint and Google Slides.
    Advertisement

    You May Also Like These PowerPoint Templates

    Add to Wishlist
    Download
    AI Customize
    Triangular chart with overlapping colored sections labeled 30% to 100%, each linked to captions areas below.
    Add to Wishlist
    Download
    AI Customize
    Best Business PowerPoint Chart Infographics Slide
    Add to Wishlist
    Download
    AI Customize
    Four colored bar charts in red, yellow, green, and orange, each with captions below, displayed on a white background.
    Free
    Add to Wishlist
    Download
    AI Customize
    Donut chart template with four segments representing different quarters with placeholder text.
    Free
    Add to Wishlist
    Download
    AI Customize
    Gantt chart with green horizontal bars representing tasks and percentages, spanning from January to December 2019.
    Add to Wishlist
    Download
    AI Customize
    3D bar chart with four colorful stacked columns in orange, blue, red, and green, each labeled with a percentage value.
    Add to Wishlist
    Download
    AI Customize
    Boost Engagement Rate PowerPoint and Google Slides Themes
    Add to Wishlist
    Download
    AI Customize
    Chart visualization slide with a circular pie chart and a horizontal bar graph for team member progress on tasks.
    Free
    Add to Wishlist
    Download
    AI Customize
    Attractive PowerPoint Templates Chart Infographics Design
    Add to Wishlist
    Download
    AI Customize
    Bar chart showing percentages from 2017 to 2021, with bars in blue, green, orange, red, and pink, and a woman illustration.
    Free
    Add to Wishlist
    Download
    AI Customize
    Business infographic PPT chart with colorful horizontal bar segments with placeholder text on a white backdrop.
    Add to Wishlist
    Download
    AI Customize
    Colorful chart infographic featuring pie charts, bar graphs, and a circular diagram with percentage values.
    Add to Wishlist
    Download
    AI Customize
    Chart template featuring a cover slide deck with a glowing stock market bar chart and multiple infographic slides.
    Add to Wishlist
    Download
    AI Customize
    Abstract PowerPoint template with four data points with icons and percentages with placeholder text.
    Add to Wishlist
    Download
    AI Customize
    Colorful chart infographic PPT slide with various percentage values displayed in horizontal bars with placeholder text.
    Free
    Add to Wishlist
    Download
    AI Customize
    Structured chart with four stacked bars in blue, red, purple, and yellow, labeled with varying percentage values.
    Free
    Add to Wishlist
    Download
    AI Customize
    Business growth slide with a 3D bar chart in multiple colors, trend lines, and descriptive text on the right side.
    Add to Wishlist
    Download
    AI Customize
    Infographics Charts PowerPoint And Google Slides Themes