Free - Free Editable Pie Chart Template PPT and Google Slides

Free
3D pie chart slide showing five colored segments with percentages each labeled with placeholder text.
P.ID : 59958
    7.4K+ views
    3.8K+ Downloads
    Get Custom Slides by Experts
    Instantly Access Templates in PowerPoint

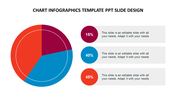
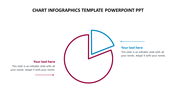
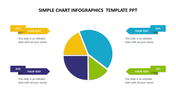
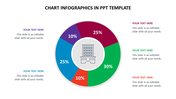
    Pie Chart Presentation Slide

    A pie chart is a circular chart used to represent data in which each category is shown as a proportion of the whole. The entire pie represents 100%, and each slice of the pie represents a specific percentage of the whole. Pie charts are commonly used in business, statistics, and finance to present data such as market share, sales figures, and budget allocations. They are easy to understand and visually appealing, making them a popular choice for presenting data in presentations and reports. You can impress your audience with this sleek template, delivering an informative presentation.

    Features of the template:

    • 100 % customizable template and easy to download. 
    • Template are available in different nodes & colors.
    • The template is contained in 16:9 and 4:3 format.
    • Easy to change the template colors quickly.
    • Highly compatible with PowerPoint and google slides.
    • Get a piece of the data pie with our Pie Chart templates
    Advertisement

    You May Also Like These PowerPoint Templates

    Add to Wishlist
    Download
    AI Customize
    Infographic showing four vertical 3D bars in different colors, each representing percentages with placeholder text area.
    Free
    Add to Wishlist
    Download
    AI Customize
    Data visualization slide showcasing an orange and black bubble chart with labeled axes and a text block on the side.
    Free
    Add to Wishlist
    Download
    AI Customize
    Wave shaped chart on a dark blue background with a detailed caption and numerical labels across the curve.
    Add to Wishlist
    Download
    AI Customize
    Horizontal bar chart with four colored bars in red, blue, purple, and pink, each labeled with a numerical value.
    Add to Wishlist
    Download
    AI Customize
    Circle chart PPT template displaying percentages in four sections with vibrant colors on a white backdrop with captions.
    Add to Wishlist
    Download
    AI Customize
    Colorful pie chart PPT template with four segments showing percentages and corresponding descriptions on the right.
    Add to Wishlist
    Download
    AI Customize
    Business PowerPoint slide displaying colorful pie charts with percent values, with text fields on a white backdrop.
    Free
    Add to Wishlist
    Download
    AI Customize
    Color coded bar chart layout with sections in red, green, purple, and blue, each with labels and a central icon.
    Add to Wishlist
    Download
    AI Customize
    Business growth infographic with orange segments, diagonal growth line, and labeled stages of organizational development.
    Add to Wishlist
    Download
    AI Customize
    Business template bar graph with stacked segments for three captions, showing percentages per month from January to December.
    Add to Wishlist
    Download
    AI Customize
    Infographic with a four level bar chart in red, green, orange, and pink, paired with percentage labels and text boxes.
    Add to Wishlist
    Download
    AI Customize
    Colorful bar chart PowerPoint slide showing percentage based growth from 25 to 100 percent with placeholder text.
    Add to Wishlist
    Download
    AI Customize
    Mekko chart slides in red and yellow gradients, showcasing various data visualizations with bars and stacked charts.
    Add to Wishlist
    Download
    AI Customize
    Chart template with data visualization in teal bars, quote section with large quotation mark, and percentage highlight.
    Free
    Add to Wishlist
    Download
    AI Customize
    Bar chart with five purple cylinders and percentages arranged from left to right, next to a professional woman in a suit.
    Add to Wishlist
    Download
    AI Customize
    Slide with five circular pie charts in orange, green, blue, gray, and red, arranged dynamically, displaying a percentage.
    Add to Wishlist
    Download
    AI Customize
    KWL slide deck with various layouts, using purple, orange, and red, illustrating the learning process in a structured format.
    Free
    Add to Wishlist
    Download
    AI Customize
    PPT Chart Infographics Free Download Design Slides
    Add to Wishlist
    Download
    AI Customize
    Colorful bar chart with five vertical bars in ascending order, each labeled with positive values and curved line above.