Best Circular Flow Chart PPT Template and Google Slides

Circular flow chart design featuring five colored segments connected to titles, centered around a gray camera icon.
P.ID : 6922
    7K+ views
    463 Downloads
    Get Custom Slides by Experts
    Instantly Access Templates in PowerPoint

    Circular Flow Chart PPT Template and Google Slides

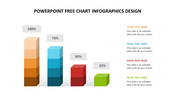
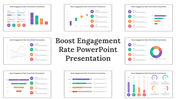
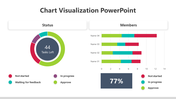
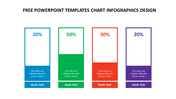
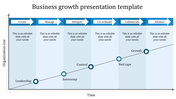
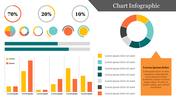
    Our circular flow chart templates make it easy to visualize and communicate complex processes. These templates are perfect for businesses, educators, and individuals who need to explain concepts like production cycles, financial transactions, and supply chain management. The circular design of these templates allows you to show how inputs, outputs, and feedback loops all interact clearly and intuitively. With customizable colors, fonts, and icons, you can tailor these templates to match your brand or style. Whether you're presenting to a group or working on a project, our circular flow chart templates will help you communicate your ideas with clarity and precision.

    Features of the template

    • 100% customizable slides and easy to download.
    • Slides are available in different nodes & colors.
    • The slide contains 16:9 and 4:3 formats.
    • Easy to change the colors of the slides quickly.
    • Well-crafted template with an instant download facility.
    • Highly compatible with PowerPoint and Google Slides.
    • Flow chart design and creative nodes.
    Advertisement

    You May Also Like These PowerPoint Templates

    Free
    Add to Wishlist
    Download
    AI Customize
    Structured chart with four stacked bars in blue, red, purple, and yellow, labeled with varying percentage values.
    Free
    Add to Wishlist
    Download
    AI Customize
    Business growth slide with a 3D bar chart in multiple colors, trend lines, and descriptive text on the right side.
    Add to Wishlist
    Download
    AI Customize
    Infographics Charts PowerPoint And Google Slides Themes
    Add to Wishlist
    Download
    AI Customize
    Slide with a circular pie chart showing data distribution in red, green, orange,  blue, and purple, with text around it.
    Add to Wishlist
    Download
    AI Customize
    A PowerPoint layout featuring five captioned text sections alongside a colorful pie chart with placeholder text.
    Add to Wishlist
    Download
    AI Customize
    PowerPoint slide with colorful bar chart infographic representing different percentages on a white backdrop.
    Free
    Add to Wishlist
    Download
    AI Customize
    Free PPT Template Presentation designs and Google Slides
    Add to Wishlist
    Download
    AI Customize
    An infographic slide featuring various charts and graphs, such as a pie chart, bar graphs, and maps, with placeholder text.
    Add to Wishlist
    Download
    AI Customize
    A pie chart template with three colored sections labeled 01, 02, and 03, each with matching captions.
    Free
    Add to Wishlist
    Download
    AI Customize
    Amazing Chart Infographics PPT Template Free Download
    Add to Wishlist
    Download
    AI Customize
    chart infographics for business slide with weekly sales data graphs, stats for indicators and networking, and colorful icons.
    Free
    Add to Wishlist
    Download
    AI Customize
    3D stacked bar chart with four vertical bars in yellow, orange, red, and pink, each labeled with numbers and text around it.
    Add to Wishlist
    Download
    AI Customize
    Three-section pie chart featuring color-coded segments: 10% orange, 15% green, and 75% red, annotated with caption areas.
    Free
    Add to Wishlist
    Download
    AI Customize
    Four percentage-based circular charts showing various progress levels, with placeholder text under each chart.
    Add to Wishlist
    Download
    AI Customize
    Circular flow chart design featuring five colored segments connected to titles, centered around a gray camera icon.
    Add to Wishlist
    Download
    AI Customize
    Best Milestone Chart PowerPoint Presentation Template
    Free
    Add to Wishlist
    Download
    AI Customize
    3D pie chart slide showing five colored segments with percentages each labeled with placeholder text.
    Add to Wishlist
    Download
    AI Customize
    A slide showing four colorful triangles labeled with percentages representing effect, planning, execution, and hard work.
    Free
    Add to Wishlist
    Download
    AI Customize
    3D pie chart template with colorful segments and text placeholders, with a personal figure pointing at the chart.