Microsoft PowerPoint Radial Chart Templates & Google Slides

Microsoft PowerPoint radial chart template featuring seven colored segments with editable text boxes around the outer circle.
P.ID : 49806
    773 views
    96 Downloads
    Get Custom Slides by Experts
    Instantly Access Templates in PowerPoint

    Engaging Radial Chart Diagram Template - Semi - circle Model

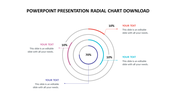
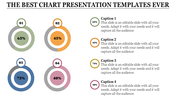
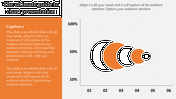
    A radial bar chart, also known as a semi-circular bar chart, displays different processes and moves around the semi-circle. Get our Microsoft PowerPoint Radial Chart Templates to present your business plan or compare the status. If you want to present your business function, use our PowerPoint. This PPT is mainly used in progress and company plan meetings. This template focuses on tracking the seven business data using a chart diagram. It is a pre-built PowerPoint with a semi-circle design to save time. This template contains seven shades with text areas. You can add or modify the font size, logo, image, and text. In addition, Users can select any Process PPT template for their needs.

    Features of this template

    • 100% Customizable (shape color, size & text)
    • This template has a semi-circle theme.
    • Huge Collections of process slides to impress your audience
    • It further supports the 16:9 and 4:3 format
    • Easily readable and acceptable template.
    Advertisement

    You May Also Like These PowerPoint Templates

    Add to Wishlist
    Download
    AI Customize
    Circle chart PPT template displaying percentages in four sections with vibrant colors on a white backdrop with captions.
    Add to Wishlist
    Download
    AI Customize
    Colorful pie chart PPT template with four segments showing percentages and corresponding descriptions on the right.
    Add to Wishlist
    Download
    AI Customize
    Business PowerPoint slide displaying colorful pie charts with percent values, with text fields on a white backdrop.
    Free
    Add to Wishlist
    Download
    AI Customize
    Color coded bar chart layout with sections in red, green, purple, and blue, each with labels and a central icon.
    Add to Wishlist
    Download
    AI Customize
    Business growth infographic with orange segments, diagonal growth line, and labeled stages of organizational development.
    Add to Wishlist
    Download
    AI Customize
    Business template bar graph with stacked segments for three captions, showing percentages per month from January to December.
    Add to Wishlist
    Download
    AI Customize
    Abstract slide featuring four vertical bars with captions and vibrant colors representing percentages in a white backdrop.
    Add to Wishlist
    Download
    AI Customize
    Infographic with a four level bar chart in red, green, orange, and pink, paired with percentage labels and text boxes.
    Add to Wishlist
    Download
    AI Customize
    Colorful bar chart PowerPoint slide showing percentage based growth from 25 to 100 percent with placeholder text.
    Add to Wishlist
    Download
    AI Customize
    Sales strategy slide with a multicolored chart, business icons, and descriptions for marketing, branding, and planning.
    Add to Wishlist
    Download
    AI Customize
    A colorful pie chart diagram with concentric circles showing percentages for different data categories in 2021.
    Add to Wishlist
    Download
    AI Customize
    Radial bar chart template set with circular data visuals, each showcasing percentages and data categories.
    Add to Wishlist
    Download
    AI Customize
    Colorful radial chart slide featuring text sections and data points with values 55, 60, 70, and 80 with placeholder text.
    Free
    Add to Wishlist
    Download
    AI Customize
    Pie chart divided into seven colored sections with percentage labels and a list of chart descriptions on the right.
    Add to Wishlist
    Download
    AI Customize
    Visual representation of a radial chart featuring eight sections numbered from one to eight placed in a white background.
    Add to Wishlist
    Download
    AI Customize
    Get Flawless Design Radial Chart in PowerPoint Model
    Add to Wishlist
    Download
    AI Customize
    Radial chart PowerPoint template with color coded concentric circles and years with placeholder text on a white backdrop.
    Add to Wishlist
    Download
    AI Customize
    Radial chart infographic with colorful segmented arcs in purple, blue, orange, red, and green, labeled with percentage.
    Add to Wishlist
    Download
    AI Customize
    A colorful radial diagram slide featuring concentric circles with text areas.