Progress Bar PowerPoint Presentation and Google Slides

A slide with a progress bar at 50% completion with multicolored segments and caption areas in a white backdrop with a title.
P.ID : 54953
    2.7K+ views
    479 Downloads
    Get Custom Slides by Experts
    Instantly Access Templates in PowerPoint

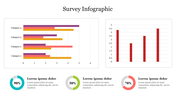
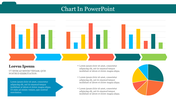
    Progress Bar Presentation Slide

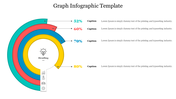
    A progress bar is a graphical user interface element that displays the progress of a task or process. It typically appears as a horizontal bar that fills in from left to right as the task progresses. Progress bars are commonly used in software applications, websites, and other digital interfaces to provide feedback to users about the status of a process, such as downloading a file, installing software, or completing a form. This template is designed to showcase progress using various types of progress bar designs. It can be used in business presentations to show progress towards goals, project timelines, or any other process that can be measured and tracked over time.

    Features of the Template

    • 100% customizable slides and easy to download.
    • The slide contains 16:9 and 4:3 formats. 
    • Slides are available in different nodes & colors.
    • Easy to change the colors of the slide quickly.
    • Well-crafted template with an instant download facility.
    • It can be used for both PowerPoint & Google Slide.
    Advertisement

    You May Also Like These PowerPoint Templates

    Add to Wishlist
    Download
    AI Customize
    Slide illustrating a goal chart with an arrow pointing at a target and four colored bars showing percentage milestones.
    Free
    Add to Wishlist
    Download
    AI Customize
    Four colorful 3D bars in varying heights and percentages, alongside icons and descriptions on a beige background.
    Add to Wishlist
    Download
    AI Customize
    Colorful 3D bar chart with pink, red, blue, and yellow bars, each labeled with percentages.
    Free
    Add to Wishlist
    Download
    AI Customize
    Infographic PowerPoint slide with three bar charts showing weekly data with percentages for each day of the week.
    Add to Wishlist
    Download
    AI Customize
    Donut chart with alternating blue and black segments, labeled with percentages, and four icon based text boxes on the right.
    Add to Wishlist
    Download
    AI Customize
    Four 3D cone charts in red, blue, teal, and green with icons at the top, and labeled for different metrics.
    Add to Wishlist
    Download
    AI Customize
    PowerPoint slide featuring a circular chart infographic with sections for text.
    Add to Wishlist
    Download
    AI Customize
    Chart with four colored bars, each featuring an icon on the left and space for text, arranged in a vertical sequence.
    Add to Wishlist
    Download
    AI Customize
    Stunning Chart Infographics Template Free Download PPT
    Free
    Add to Wishlist
    Download
    AI Customize
    PowerPoint infographic with four colored pill shaped sections each labeled with placeholder text.
    Add to Wishlist
    Download
    AI Customize
    Chart infographic template with three progress bars in blue, red, and green accompanied by icons.
    Add to Wishlist
    Download
    AI Customize
    Chart infographic template with different chart types, including pie charts, bar charts, and a donut chart.
    Free
    Add to Wishlist
    Download
    AI Customize
    Infographic chart with four colorful blocks, each displaying a percentage, connected by a gray upward arrow.
    Add to Wishlist
    Download
    AI Customize
    Bubble Scatter PowerPoint Template With Three Nodes
    Add to Wishlist
    Download
    AI Customize
    SWOT chart PPT template with four categories each with corresponding color coded icons and percentages on a white backdrop.
    Add to Wishlist
    Download
    AI Customize
    Infographic slide with two colorful line charts from 2016 to 2019, on a blurred background of a tablet displaying data.
    Add to Wishlist
    Download
    AI Customize
    Download Unlimited Chart Template Presentation
    Add to Wishlist
    Download
    AI Customize
    Four distinct lines in blue, red, orange, and green on a line graph, with corresponding numbered captions beside.
    Add to Wishlist
    Download
    AI Customize
    Creative Asset Turnover PowerPoint Presentation PPT Slide