Creative Logistics KPI Metrics Business PPT

Four colored semicircles for country data with percentages, and bottom section with three colorful circles for metrics.
P.ID : 52450
    840 views
    68 Downloads
    Get Custom Slides by Experts
    Instantly Access Templates in PowerPoint

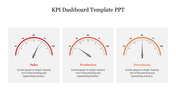
    Creative Logistics KPI Metrics For Presentation

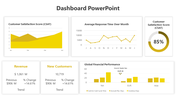
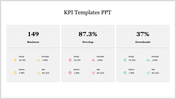
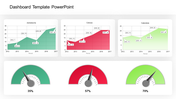
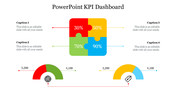
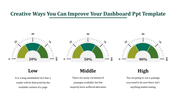
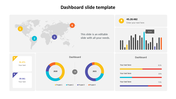
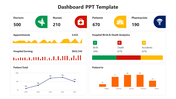
    Download this logistics KPI metrics business PPT template to create an attractive presentation. It helps to measure the performance of the logistic department. This template has a colorful visual design to enhance your presentation.


    About this template

    Use logistics KPI metrics business PPT slide for various metrics like purchasing, transport, warehouse, and locations. It is the best template that you can use for logistic purposes. You can, in addition, add icons, designs, and text to impress the audience. Download more creative KPI templates from SlideEgg.


    Feature of this Template   

    1. 100% customizable slides and easy to download.

    2. Slides available in different nodes & colors.

    3. The slide contained 16:9 and 4:3 formats.

    4. Easy to change the slide colors quickly.

    5. Well-crafted template with instant download facility.

    6. It is a well-designed presentation template.

    7. Best KPI for creative Presentation.   

    Advertisement

    You May Also Like These PowerPoint Templates

    Add to Wishlist
    Download
    AI Customize
    Use Dashboard PPT Template Slide Designs
    Free
    Add to Wishlist
    Download
    AI Customize
    Dashboard template with three colorful gauge icons in the center and text boxes in green, blue, and gold.
    Add to Wishlist
    Download
    AI Customize
    KPI dashboard with bar graphs showing data trends over time and two green summary boxes.
    Free
    Add to Wishlist
    Download
    AI Customize
    Dashboard PPT template featuring a speedometer with labeled sections like Direction, Objectives, Data, Business, and Study.
    Add to Wishlist
    Download
    AI Customize
    Vehicle dashboard slide featuring a speedometer on the left and a detailed table on the right with its brands.
    Add to Wishlist
    Download
    AI Customize
    KPI template showing a bar chart with four cases, and two circular progress indicators in blue and orange showing percentage.
    Add to Wishlist
    Download
    AI Customize
    A slide displaying dashboard elements like bar graphs, a world map with data points, and progress bars, with captions.
    Add to Wishlist
    Download
    AI Customize
    Marketing KPI dashboard comparing Google, Facebook, and Bing ads, featuring clicks, cost, line charts, and campaign analysis.
    Free
    Add to Wishlist
    Download
    AI Customize
    Visual of project phases and value generation over time, with milestones labeled as planning, detailing, and implementation.
    Add to Wishlist
    Download
    AI Customize
    Business slide with four sections representing different concepts Equality, Human Rights, Independent, and Multi Party.
    Add to Wishlist
    Download
    AI Customize
    Dashboard slide with metrics for social media, including followers, engagement, impressions, and reviews in charts.
    Add to Wishlist
    Download
    AI Customize
    KPI PPT slide featuring circular progress indicators and a table of data values with captions on a white backdrop.
    Add to Wishlist
    Download
    AI Customize
    Sales KPI PPT slide featuring charts for Revenue, Revenue Comparison, New Customers, and Customer Acquisition Cost CAS.
    Add to Wishlist
    Download
    AI Customize
    Dashboard with charts and metrics, including pie chart for sales, bar and line charts, and visitor statistics.
    Add to Wishlist
    Download
    AI Customize
    Dashboard slide displaying upcoming deposits, transactions, market location, and financial data on a dark backdrop.
    Add to Wishlist
    Download
    AI Customize
    KPI slide displaying a financial table for FY 2018, with figures for Net Sales, Income, and Expenses for each quarter.