Gantt Chart Google Slides and PPT Template Presentation

Gantt chart slide with horizontal gray task bars and percentage completion for months in a color coded header.
P.ID : 66528
    625 views
    107 Downloads
    Get Custom Slides by Experts
    Instantly Access Templates in PowerPoint

    Best Gantt Chart Google Slides Presentation Template

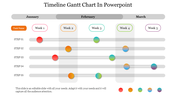
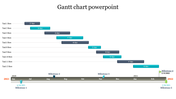
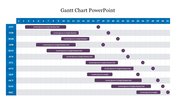
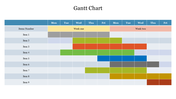
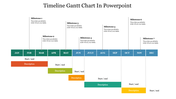
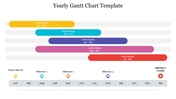
    This Best Gantt Chart Google Slides Presentation Template is one of the best Gantt charts PPT templates from SlideEgg. This is a twelve nodded template. A Gantt chart aids monitor the project's improvement by displaying how tasks correlate to each other. It is a bar chart with the x-axis and y-axis depicting tasks in a timeline.

    Construct creative Gantt charts presentations with this Best Gantt Chart Google Slides Presentation Template. This is a proficiently well-designed template. This pre-built template assists you in creating the presentation in no time. This is a 100% user-friendly template.

    The nodes are horizontally arranged at the centre of this template. Each node has separate bars with distinct proportions. Each node represents each month in a year in this template. It represents from January to December month.

    Use this elegant template to let your audience get your presentation at their first glance. Grab now!!!

    Features of this template:

    • 100% customizable slides and easy to download.
    • Slides available in different nodes & colors.
    • The slide contained 16:9 and 4:3 format.
    • Easy to change the slide colors quickly.
    • Well-crafted template with instant download facility.
    • Premium template with an elegant outlook.
    • Top grade twelve-node featured template.
    Advertisement

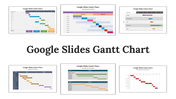
    You May Also Like These PowerPoint Templates

    Free
    Add to Wishlist
    Download
    AI Customize
    Simple Gantt chart slide displaying task schedules across three months with each task's duration represented by colored bars.
    Add to Wishlist
    Download
    AI Customize
    Horizontal Gantt chart with colored bars showing different project phases across months from 2019 to 2020.
    Add to Wishlist
    Download
    AI Customize
    Gantt chart slide with horizontal gray task bars and percentage completion for months in a color coded header.
    Add to Wishlist
    Download
    AI Customize
    Color coded Gantt chart slide outlining a yearly project timeline with quarterly milestones and description boxes.
    Add to Wishlist
    Download
    AI Customize
    Gantt chart displaying task progress for seven steps, each represented by colored bars spanning from January to June.
    Add to Wishlist
    Download
    AI Customize
    Gantt chart slide showing a project timeline with tasks categorized into colorful sections, represented by horizontal bars.
    Add to Wishlist
    Download
    AI Customize
    Gantt chart template showing tasks with percentage completion values, organized along a thirty one days colored timeline.
    Add to Wishlist
    Download
    AI Customize
    Slide with a chart layout showing timeline across four weeks, with tasks in blue, green, yellow, and orange bars.
    Add to Wishlist
    Download
    AI Customize
    Timeline with months of the year, colored task bars, and markers showing different project milestones and durations.
    Free
    Add to Wishlist
    Download
    AI Customize
    Gantt chart slide showing six tasks with progress bars, each reflecting completion levels ranging from 30% to 80%.
    Add to Wishlist
    Download
    AI Customize
    Detailed timeline tracking activities across months, with stars highlighting milestones and a release flag at the end.
    Add to Wishlist
    Download
    AI Customize
    Horizontal Gantt chart with blue bars representing tasks, timeline from March to April 2020, and gray grid lines.
    Add to Wishlist
    Download
    AI Customize
    A Gantt chart timeline highlighting milestones from January to December with a marker for today's date in May.
    Add to Wishlist
    Download
    AI Customize
    Six-month Gantt chart template spanning July to December 2020 with weekly divisions and task rows.
    Add to Wishlist
    Download
    AI Customize
    Horizontal gantt chart displaying six projects with colored bars showing timelines across months.
    Add to Wishlist
    Download
    AI Customize
    Gantt chart displaying tasks with varying progress percentages over a 31-day timeline using colored bars.