Extraordinary Cool Gantt Chart PowerPoint Presentation

Gantt chart displaying tasks with varying progress percentages over a 31-day timeline using colored bars.
P.ID : 46824
    944 views
    133 Downloads
    Get Custom Slides by Experts
    Instantly Access Templates in PowerPoint

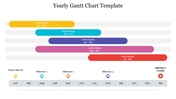
    Creative Gantt Chart PowerPoint Template With Colorful Bars

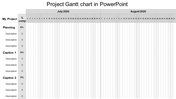
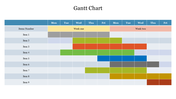
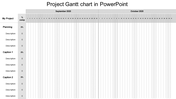
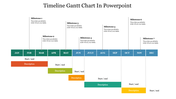
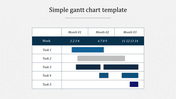
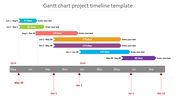
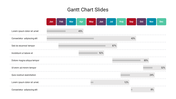
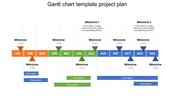
    If you are super conscious about finishing your project on time and want to assess how long a project should take to complete. Try our Cool Gantt Chart PowerPoint slide to monitor a project's progress and activities with your client or investor. We provide a 3d chart with colorful bars to visually represent your project plan over time. You can add more than ten project data to this PowerPoint to add the entire project schedule from start to finish. Download it and give your speech with confidence.

    Features of the Template

    • 100 % customizable slides and easy to download
    • Slides are available in different nodes & colors.
    • This PowerPoint has bars.
    • The slide contained 16:9 and 4:3 formats.
    • It comes with a chart theme.
    • Easy to change the slide colors quickly.
    • It is a well-crafted template with an instant download facility.
    • It is designed with a stunning theme design.
    Advertisement

    You May Also Like These PowerPoint Templates

    Add to Wishlist
    Download
    AI Customize
    Gantt chart displaying task progress for seven steps, each represented by colored bars spanning from January to June.
    Add to Wishlist
    Download
    AI Customize
    Gantt chart slide showing a project timeline with tasks categorized into colorful sections, represented by horizontal bars.
    Add to Wishlist
    Download
    AI Customize
    Gantt chart template showing tasks with percentage completion values, organized along a thirty one days colored timeline.
    Add to Wishlist
    Download
    AI Customize
    Slide with a chart layout showing timeline across four weeks, with tasks in blue, green, yellow, and orange bars.
    Add to Wishlist
    Download
    AI Customize
    Timeline with months of the year, colored task bars, and markers showing different project milestones and durations.
    Free
    Add to Wishlist
    Download
    AI Customize
    Gantt chart slide showing six tasks with progress bars, each reflecting completion levels ranging from 30% to 80%.
    Add to Wishlist
    Download
    AI Customize
    Detailed timeline tracking activities across months, with stars highlighting milestones and a release flag at the end.
    Add to Wishlist
    Download
    AI Customize
    Horizontal Gantt chart with blue bars representing tasks, timeline from March to April 2020, and gray grid lines.
    Add to Wishlist
    Download
    AI Customize
    A Gantt chart timeline highlighting milestones from January to December with a marker for today's date in May.
    Add to Wishlist
    Download
    AI Customize
    Six-month Gantt chart template spanning July to December 2020 with weekly divisions and task rows.
    Add to Wishlist
    Download
    AI Customize
    Horizontal gantt chart displaying six projects with colored bars showing timelines across months.
    Add to Wishlist
    Download
    AI Customize
    Gantt chart displaying tasks with varying progress percentages over a 31-day timeline using colored bars.
    Add to Wishlist
    Download
    AI Customize
    Gantt chart with a timeline from 2014 to 2019, featuring colored bars and milestones in green, blue, and orange.
    Add to Wishlist
    Download
    AI Customize
    Project timeline Gantt chart divided into two halves, showcasing task completion levels with gray progress bars.
    Add to Wishlist
    Download
    AI Customize
    Attractive Gantt Chart Sample PowerPoint Presentation