Statistics Project PowerPoint Template and Google Slides

Statistics Project Presentation Slide
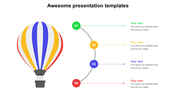
Embarking on a statistics project is akin to revealing the hidden insights within data, involving the collection, analysis, and interpretation of information to derive meaningful conclusions. It goes beyond mere numbers, offering a structured approach to understanding the significance of numerical data and making informed decisions. The concept of a statistics project lies in its power to transform raw data into valuable knowledge, providing a crucial tool for predicting trends, testing hypotheses, and uncovering patterns. This PowerPoint template caters to professionals, researchers, and students engaged in statistical analysis, offering a user-friendly platform to visually represent findings. A constellation of nodes and icons illuminates key trends and findings. Easily adaptable to your specific needs, this template enables you to craft a compelling narrative, transforming raw numbers into a rich tapestry of knowledge. Let this presentation tool be your guide as you embark on an expedition of discovery, unveiling the secrets concealed within the depths of your statistical landscape. With 100% editability, users can customize content and design, making it a valuable asset for presenting complex statistical information with clarity and professionalism. The benefits for the presenter include saving time on design, enhancing audience comprehension, and creating visually impactful presentations, ensuring a lasting impression on the audience.
Features of this template
- 100% customizable slides and easy to download.
- Slides available in different nodes & colors.
- The slides contained 16:9 and 4:3 formats.
- Easy to change the slide colors quickly.
- Well-crafted template with instant download facility.
- The informative project slide for the creative presentation.


You May Also Like These PowerPoint Templates
Add to Wishlist
Download
AI Customize

Add to Wishlist
Download
AI Customize


Add to Wishlist
Download
AI Customize

Add to Wishlist
Download
AI Customize

Add to Wishlist
Download
AI Customize

Add to Wishlist
Download
AI Customize

Add to Wishlist
Download
AI Customize

Add to Wishlist
Download
AI Customize

Add to Wishlist
Download
AI Customize

Add to Wishlist
Download
AI Customize

Add to Wishlist
Download
AI Customize

Add to Wishlist
Download
AI Customize

Add to Wishlist
Download
AI Customize


Add to Wishlist
Download
AI Customize


Add to Wishlist
Download
AI Customize

Add to Wishlist
Download
AI Customize

Add to Wishlist
Download
AI Customize
