Amazing Logistics KPI Metrics PPT Presentation Design

 Canva
Canva
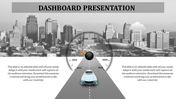
Amazing Logistics KPI Metrics PPT Presentation
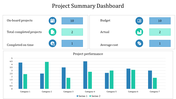
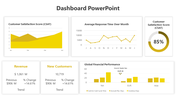
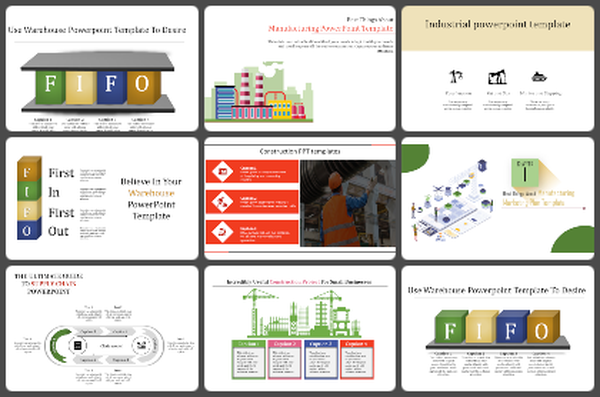
Download the logistics KPI metrics PPT presentation to do a fantastic presentation on business performance. It is considered a quantitative tool used to measure your business performance. Logistic managers use this to track, visualize and optimize all relevant logistic processes. You can use this to monitor your performance and analyze your way to achieving success.
About the template
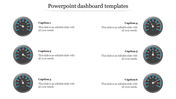
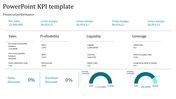
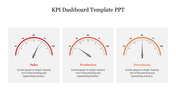
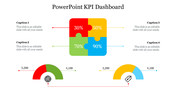
Using the Logistics KPI metrics PPT presentation, you can measure the transportation, warehouse, and supply chain costs. Here the rectangular and circle designs are added, and colors are used in this slide. Professional icons are used in this template to add details rigidly. You can add percentage values and the warehouse operating cost in the circles. Download Now!!
Features of this template:
100% customizable slides and easy to download.Slides available in different nodes & colors.
The slide contained 16:9 and 4:3 format.
Easy to change the slide colors quickly.
Well-crafted template with instant download facility.

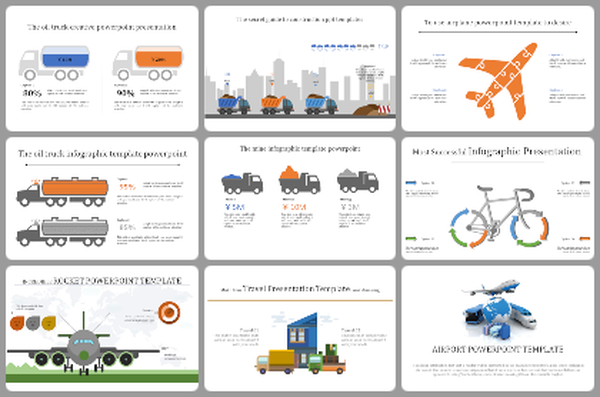
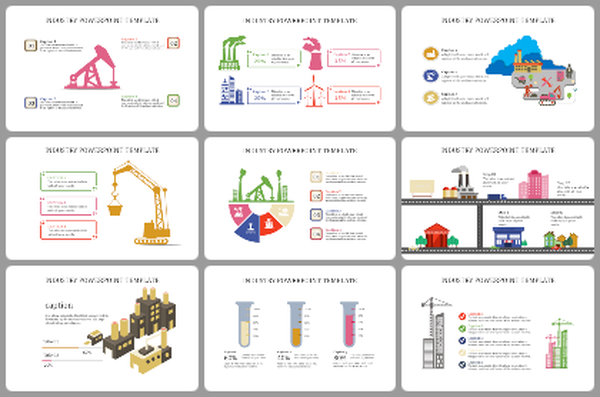
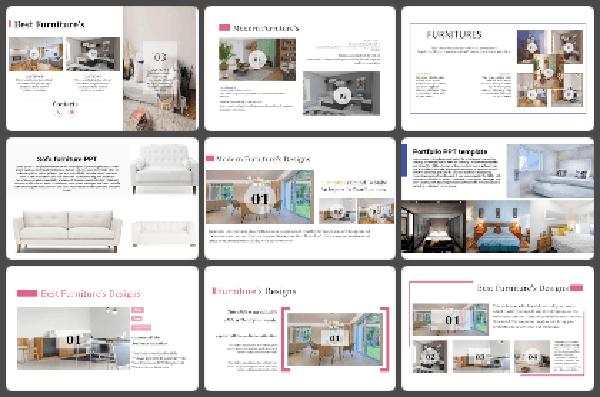

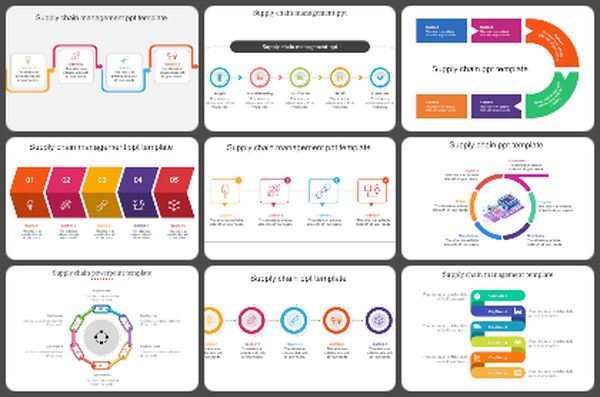
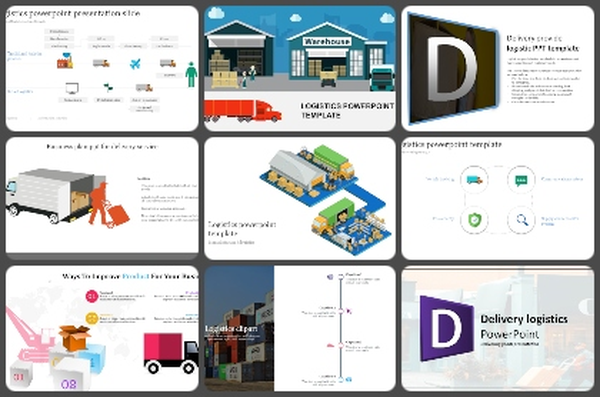
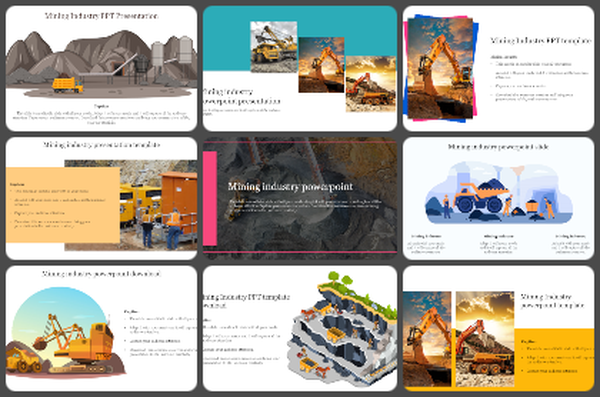
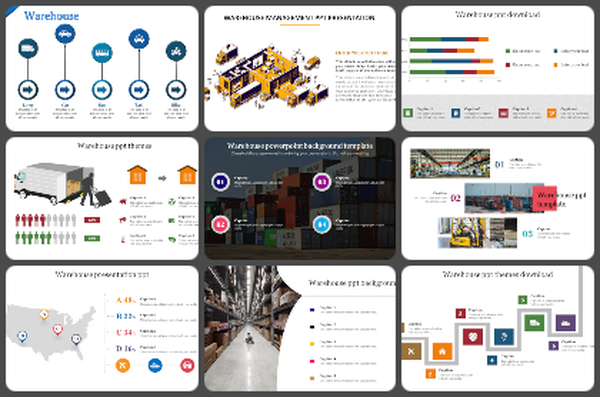
You May Also Like These PowerPoint Templates
Add to Wishlist
Download
AI Customize

Add to Wishlist
Download
AI Customize

Add to Wishlist
Download
AI Customize

Add to Wishlist
Download
AI Customize

Add to Wishlist
Download
AI Customize

Add to Wishlist
Download
AI Customize

Add to Wishlist
Download
AI Customize


Add to Wishlist
Download
AI Customize

Add to Wishlist
Download
AI Customize

Add to Wishlist
Download
AI Customize


Add to Wishlist
Download
AI Customize


Add to Wishlist
Download
AI Customize

Add to Wishlist
Download
AI Customize

Add to Wishlist
Download
AI Customize

Add to Wishlist
Download
AI Customize

Add to Wishlist
Download
AI Customize

Add to Wishlist
Download
AI Customize
