Best Linear KPI Infographics PowerPoint Presentation

KPI Infographics Presentation Slides
Like any good superhero, your KPI dashboard needs to help you save the day. The infographics of this slide explain why you need a dashboard and how to create it. It gives an overview of the right dashboard design too! Measuring progress is one of the most important aspects to have a healthy business. It enables you to cover performance, which will ultimately help you achieve success. This set of slides is a great tool to give your business a competitive edge.
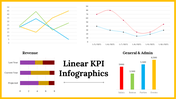
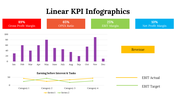
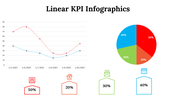
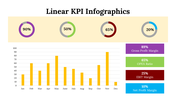
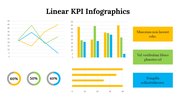
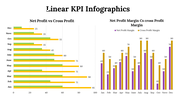
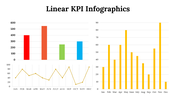
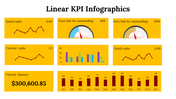
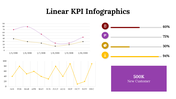
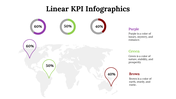
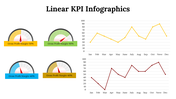
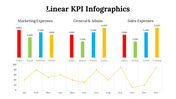
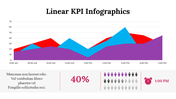
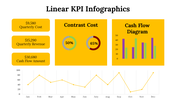
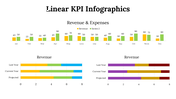
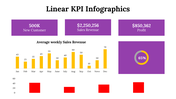
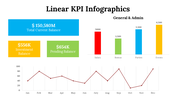
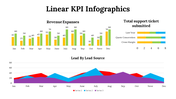
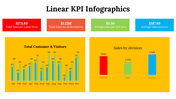
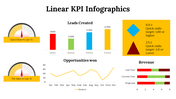
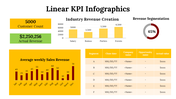
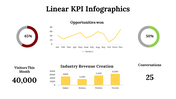
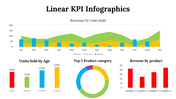
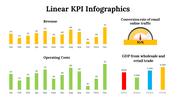
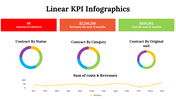
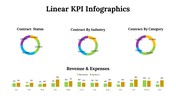
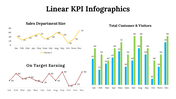
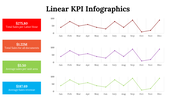
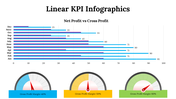
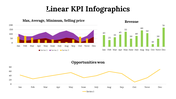
A glance at its beautifully designed design, and you'll immediately recognize that it's ideal for marketing or sales sites. A bar graph of key KPIs, a line graph of performance-related statistics, and pie charts representing the company's overall performance are just some of the features included in our Simple KPI PowerPoint Templates. And what makes you stand out of the crowd? That's the unique presentation of your data! And you'll definitely need this pack of slides for your need! Get it now and bag your accolades.
Features of the template
- 100% customizable slides and easy to download.
- Slides are available in different nodes & colors.
- The slide contains 16:9 and 4:3 formats.
- Easy to change the slide colors quickly.
- Well-crafted template with an instant download facility.
- Pack of 36 stunning slides.


You May Also Like These PowerPoint Templates


