Fantastic PowerPoint Speedometer Template Presentation

PowerPoint speedometer template featuring three speed gauges.
P.ID : 21041
    193 views
    1 Downloads
    Get Custom Slides by Experts
    Instantly Access Templates in PowerPoint

    Three Innovative Speedometer Template


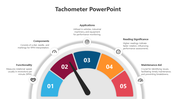
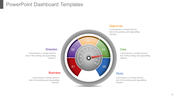
    Possess this speedometer diagram PowerPoint template to provide a detailed explanation about your desired business and general topics. You can provide a deep illustration through the three-node given here, which are colorful with their attractive diagram and graphics. You can even add points related to speed using this productive template. So hurry up and get this downloaded.

    Features Of The Template

    • 100% customizable slides and easy to download
    • Slides are available in different nodes & colors.
    • The slides contained 16:9 and 4:3 formats.
    • Easy to change the slide colors quickly.
    • Well-crafted template with instant download facility.
    • Crisp and elegant font style. 
    • The best template with attractive nodes.
    Advertisement

    You May Also Like These PowerPoint Templates

    Add to Wishlist
    Download
    AI Customize
    Credit score meter with a needle in the center, displaying risk levels on a gradient from yellow to blue with caption areas.
    Free
    Add to Wishlist
    Download
    AI Customize
    Two speedometers with red and purple needle pointers, with caption and corresponding colored dots below.
    Add to Wishlist
    Download
    AI Customize
    3D sales chart displaying a 60 percent sales progress with an informative text section and interactive button on blue theme.
    Add to Wishlist
    Download
    AI Customize
    Dashboard template displaying a project timeline with a Gantt chart, project details, and phases from initiation to closure.
    Add to Wishlist
    Download
    AI Customize
    Sales report slide showing metrics like sales volume, profit margin, and a gauge chart along with a bar graph.
    Add to Wishlist
    Download
    AI Customize
    Sentiment meter infographic displaying six emotions in a colorful fan design, each labeled with placeholders text areas.
    Add to Wishlist
    Download
    AI Customize
    KPI Dashboard PowerPoint template displaying key metrics, including count of contracts, revenues, and costs.
    Add to Wishlist
    Download
    AI Customize
    Tachometer template with percentage markers and color-coded designs, each paired with caption areas.
    Add to Wishlist
    Download
    AI Customize
    Executive dashboard template showcasing growth, progress, and performance metrics for effective management.
    Add to Wishlist
    Download
    AI Customize
    Dashboard slide with two green gauge meters, each labeled with a caption and text below.
    Add to Wishlist
    Download
    AI Customize
    Microsoft dashboard slide showcasing supply chain costs, inventory to sales ratio, and carrying cost of inventory.
    Add to Wishlist
    Download
    AI Customize
    Project status dashboard slide displaying budgets and performance metrics for banners, social media, and brochures.
    Add to Wishlist
    Download
    AI Customize
    PowerPoint slide with a tachometer graphic showing numbers 1 through 8 in different colors, with placeholders for captions.
    Add to Wishlist
    Download
    AI Customize
    Colorful tachometer PowerPoint slide design with transportation icons including airplane, car, bus, and train with captions.
    Add to Wishlist
    Download
    AI Customize
    Ten speedometer icons in two rows, each with blue, green, and red segments, ranging from 0 to 100.
    Add to Wishlist
    Download
    AI Customize
    Tachometer slide with four gauges in orange, red, blue, and green, each with captions below describing different readings.
    Add to Wishlist
    Download
    AI Customize
    Dashboard with bar charts, line graphs, and a gauge chart in various colors and a percentage indicator, on white background.
    Add to Wishlist
    Download
    AI Customize
    Slide displaying a profit and loss presentation with a colorful gauge in the center, indicating profit and loss levels.
    Add to Wishlist
    Download
    AI Customize
    KPI dashboard layout with a yellow header, two gauge in teal and green, bar metrics, and pie charts on a light background.