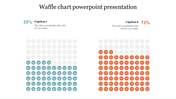
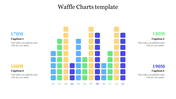
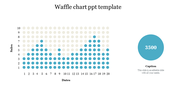
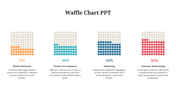
Waffle Chart PowerPoint Presentation And Google Slides

Attractive Harvey Balls PowerPoint Template
A Harvey Balls chart is a particular state indicator frequently used for comparison in reports and presentations. This visual aid may be used in several comparisons, such as assessing a product's weight, price, flavor, quality, and other factors. Thus, how effectively you operate determines your probity. Use this template to inspire your teammates and coworkers to approach their work with assurance despite comparisons. You can see how the concept of your presentation was cleverly two-nodded. Use this template to provide a visual treat for your audience during meetings or group gatherings.
Features of the template
- 100 % customizable slides and easy to download.
- Slides are available in different colors
- The slide has 4:3 and 16:9 formats.
- Easy to change the slide colors quickly.
- Appealing presentation to impress an audience.
- Create feature-rich slide presentations.
- An eye-pleasing color slide helps to give a catchy presentation.
- Crisp and clear font styles.
- Two nodded Harvey balls design


You May Also Like These PowerPoint Templates
Add to Wishlist
Download
Edit

Add to Wishlist
Download
Edit

Add to Wishlist
Download
Edit

Add to Wishlist
Download
Edit

Add to Wishlist
Download
Edit

Add to Wishlist
Download
Edit

Add to Wishlist
Download
Edit

Add to Wishlist
Download
Edit

Add to Wishlist
Download
Edit

Add to Wishlist
Download
Edit

Add to Wishlist
Download
Edit

Add to Wishlist
Download
Edit

Add to Wishlist
Download
Edit

Add to Wishlist
Download
Edit

Add to Wishlist
Download
Edit


Add to Wishlist
Download
Edit

Add to Wishlist
Download
Edit


Add to Wishlist
Download
Edit
