Editable Waffle Diagrams Infographics PPT And Google Slides

Waffle chart showing three percentages of 43% maroon, 61% red, and 38% yellow, with circles indicating completion.
P.ID : 69234
    191 views
    39 Downloads
    Get Custom Slides by Experts
    Instantly Access Templates in PowerPoint

    Waffle Diagram Infographics Presentation Slide

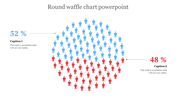
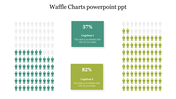
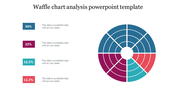
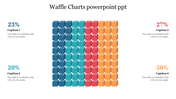
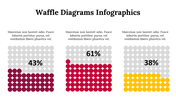
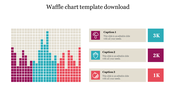
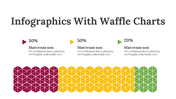
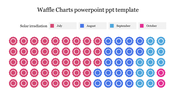
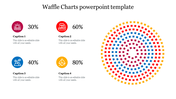
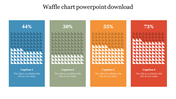
    Yummie! Yummie! Waffles. Hold on a minute; Is it a waffle in a presentation? Hey, you're shocked, right? It's not a real one, a waffle diagram. I Hope you are curious to know how it works. A waffle diagram is a vital tool used to represent the data of multiple categories in a grid close like waffles. It helps to show the distributed data in an appealing way. Box the Slide Egg waffle slide, prepared especially in colored flavors to differentiate the categories or variables. Try Now!

    Features of the template

    • 100% customizable slides and easy to download.
    • Slides are available in different nodes & colors.
    • The slide contains 16:9 and 4:3 formats.
    • Easy to change the colors of the slide quickly.
    • Well-crafted template with an instant download facility.
    • Color waffle with perfect matrix or grid.
    • Three waffles with various colors look impressive.
    • Compatible with Google slides and MS PowerPoint.
    Advertisement

    You May Also Like These PowerPoint Templates

    Add to Wishlist
    Download
    AI Customize
    Waffle chart analysis slide with multicolored circular data markers with caption sections.
    Add to Wishlist
    Download
    AI Customize
    Waffle chart with apple icons in blue, green, orange, and red, paired with four labeled captions areas on the right.
    Free
    Add to Wishlist
    Download
    AI Customize
    Hexagonal waffle chart with blue, red, and orange sections illustrating proportions and caption areas.
    Add to Wishlist
    Download
    AI Customize
    PPT slide showing a colorful waffle chart with categories Medium, High, and Critical with captions on a white backdrop.
    Add to Wishlist
    Download
    AI Customize
    Waffle chart analysis with four percentage based diamond grid visuals in blue, green, orange, and red.
    Add to Wishlist
    Download
    AI Customize
    Waffle Chart Microsoft PPT Presentation Slide
    Add to Wishlist
    Download
    AI Customize
    Waffle Chart Analysis PowerPoint Template Slides
    Add to Wishlist
    Download
    AI Customize
    Infographic with two grid based waffle charts using emoji icons in blue and red, showing percentages with captions.
    Add to Wishlist
    Download
    AI Customize
    Waffle chart with twelve columns of colored squares in blue, green, yellow, and purple, with matching captions on both sides.
    Add to Wishlist
    Download
    AI Customize
    Waffle chart with blue circles representing sales data over days, alongside a large circular indicator displaying number.
    Add to Wishlist
    Download
    AI Customize
    Waffle chart PowerPoint slide with color coded blocks representing different risk levels with captions on a white backdrop.
    Add to Wishlist
    Download
    AI Customize
    Waffle Chart PowerPoint Presentation And Google Slides
    Add to Wishlist
    Download
    AI Customize
    PowerPoint slide with three waffle charts representing percentages in red, green, and blue sections with captions.
    Add to Wishlist
    Download
    AI Customize
    Waffle Charts PPT PowerPoint Presentation
    Add to Wishlist
    Download
    AI Customize
    Semi circular waffle chart with blue and pink segments, illustrating percentage differences in two categories.
    Add to Wishlist
    Download
    AI Customize
    Waffle charts in four colors representing percentages 54% in blue, 70% in green, 60% in orange, and 40% in red.
    Add to Wishlist
    Download
    AI Customize
    Waffle chart slide comparing two categories in blue and green, with percentage based bar visuals for five options.
    Add to Wishlist
    Download
    AI Customize
    Slide with four waffle charts, each displaying a percentage with colored square grids in blue, red, orange, and green.
    Add to Wishlist
    Download
    AI Customize
    Simple Waffle Chart Analysis PowerPoint Download
    Add to Wishlist
    Download
    AI Customize
    Four colored waffle charts showing different percentage values with corresponding captions and placeholder text.