Simple Waffle Chart Analysis PowerPoint Download

Simple Waffle Chart Analysis PowerPoint Download
P.ID : 48060
    262 views
    55 Downloads
    Get Custom Slides by Experts
    Instantly Access Templates in PowerPoint

    Creative Waffle Chart PPT Template

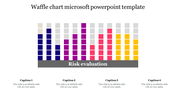
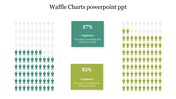
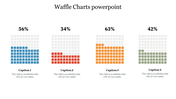
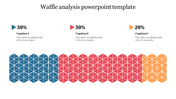
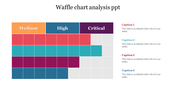
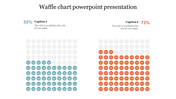
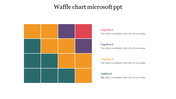
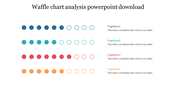
    More segmented areas of data are shown with accuracy in different colored portions. The dots with the color shades make the best format to understand the data effectively. This method helps to form an arranged order in data transcription. This effective template can improvise the percentage of your data level with accurate dimensions. The multilateral dimension used in the template makes the best outcome as this template is fully customized and is added with three nodes. Download this unique template and gain the effect. Download now!

    Features of the Template:

    • 100% customizable slides and easy to download.
    • The slide contains 16:9 and 4:3 formats. 
    • Slides are available in different nodes & colors. 
    • Easy to change the colors of the slide quickly.
    • Well-crafted template with an instant download facility.
    • Three nodes with dots design.
    Advertisement

    You May Also Like These PowerPoint Templates

    Add to Wishlist
    Download
    AI Customize
    Waffle chart PowerPoint slide with color coded blocks representing different risk levels with captions on a white backdrop.
    Add to Wishlist
    Download
    AI Customize
    PowerPoint slide with three waffle charts representing percentages in red, green, and blue sections with captions.
    Add to Wishlist
    Download
    AI Customize
    Waffle Charts PPT PowerPoint Presentation
    Add to Wishlist
    Download
    AI Customize
    Waffle chart slide comparing two categories in blue and green, with percentage based bar visuals for five options.
    Add to Wishlist
    Download
    AI Customize
    Semi circular waffle chart with blue and pink segments, illustrating percentage differences in two categories.
    Add to Wishlist
    Download
    AI Customize
    Waffle charts in four colors representing percentages 54% in blue, 70% in green, 60% in orange, and 40% in red.
    Add to Wishlist
    Download
    AI Customize
    Slide with four waffle charts, each displaying a percentage with colored square grids in blue, red, orange, and green.
    Add to Wishlist
    Download
    AI Customize
    Simple Waffle Chart Analysis PowerPoint Download
    Add to Wishlist
    Download
    AI Customize
    Four colored waffle charts showing different percentage values with corresponding captions and placeholder text.
    Add to Wishlist
    Download
    AI Customize
    Colorful waffle chart with segmented blue, teal, red, and orange blocks, surrounded by corresponding percentage captions.
    Add to Wishlist
    Download
    AI Customize
    Pixelated chart with teal, blue, and red columns, and three corresponding caption boxes on the right.
    Add to Wishlist
    Download
    AI Customize
    Waffle chart design with circular icons arranged in five rows, color coded in pink, blue, and teal to represent months.
    Add to Wishlist
    Download
    AI Customize
    Waffle chart PowerPoint slide displaying percentages with color markers and icons with placeholder text.
    Free
    Add to Wishlist
    Download
    AI Customize
    Four waffle chart sections show percentages with corresponding captions.
    Add to Wishlist
    Download
    AI Customize
    Waffle chart analysis slide with multicolored circular data markers with caption sections.
    Add to Wishlist
    Download
    AI Customize
    Waffle chart with apple icons in blue, green, orange, and red, paired with four labeled captions areas on the right.
    Free
    Add to Wishlist
    Download
    AI Customize
    Hexagonal waffle chart with blue, red, and orange sections illustrating proportions and caption areas.
    Add to Wishlist
    Download
    AI Customize
    PPT slide showing a colorful waffle chart with categories Medium, High, and Critical with captions on a white backdrop.