Waffle Charts PPT PowerPoint Presentation

Waffle Charts PPT PowerPoint Presentation
P.ID : 47964
    93 views
    12 Downloads
    Get Custom Slides by Experts
    Instantly Access Templates in PowerPoint

    Waffle Charts PowerPoint Slide

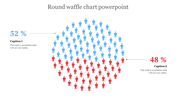
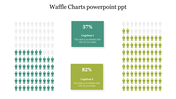
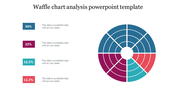
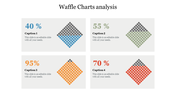
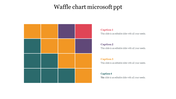
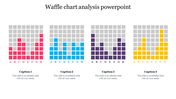
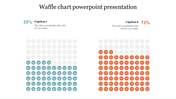
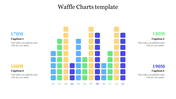
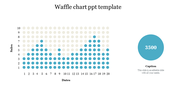
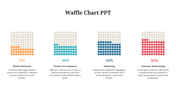
    So, how do you start designing a waffle chart? Well, the first thing you need to do is decide what data you will display on this chart. Now, select the bang of the buck slide; that's our Waffle chart PPT Slide. You can plot your data perfectly in this slide so that each series's percentage becomes obvious to the viewer. Also, include some other text in between each node on the chart to make it look more interesting and engaging. That's all! You're done with your waffle chart PPT. Easy isn't it?

    Features of the template

    • 100% customizable slides and easy to download.
    • Slides are available in different nodes & colors.
    • The slide contained 16:9 and 4:3 formats.
    • Easy to change the slide colors quickly.
    • Well-crafted template with an instant download facility.
    • Amicable edit features.
    Advertisement

    You May Also Like These PowerPoint Templates

    Add to Wishlist
    Download
    AI Customize
    Waffle chart PowerPoint slide with color coded blocks representing different risk levels with captions on a white backdrop.
    Add to Wishlist
    Download
    AI Customize
    PowerPoint slide with three waffle charts representing percentages in red, green, and blue sections with captions.
    Add to Wishlist
    Download
    AI Customize
    Waffle Charts PPT PowerPoint Presentation
    Add to Wishlist
    Download
    AI Customize
    Waffle chart slide comparing two categories in blue and green, with percentage based bar visuals for five options.
    Add to Wishlist
    Download
    AI Customize
    Semi circular waffle chart with blue and pink segments, illustrating percentage differences in two categories.
    Add to Wishlist
    Download
    AI Customize
    Waffle charts in four colors representing percentages 54% in blue, 70% in green, 60% in orange, and 40% in red.
    Add to Wishlist
    Download
    AI Customize
    Slide with four waffle charts, each displaying a percentage with colored square grids in blue, red, orange, and green.
    Add to Wishlist
    Download
    AI Customize
    Simple Waffle Chart Analysis PowerPoint Download
    Add to Wishlist
    Download
    AI Customize
    Four colored waffle charts showing different percentage values with corresponding captions and placeholder text.
    Add to Wishlist
    Download
    AI Customize
    Colorful waffle chart with segmented blue, teal, red, and orange blocks, surrounded by corresponding percentage captions.
    Add to Wishlist
    Download
    AI Customize
    Pixelated chart with teal, blue, and red columns, and three corresponding caption boxes on the right.
    Add to Wishlist
    Download
    AI Customize
    Waffle chart design with circular icons arranged in five rows, color coded in pink, blue, and teal to represent months.
    Add to Wishlist
    Download
    AI Customize
    Waffle chart PowerPoint slide displaying percentages with color markers and icons with placeholder text.
    Free
    Add to Wishlist
    Download
    AI Customize
    Four waffle chart sections show percentages with corresponding captions.
    Add to Wishlist
    Download
    AI Customize
    Waffle chart analysis slide with multicolored circular data markers with caption sections.
    Add to Wishlist
    Download
    AI Customize
    Waffle chart with apple icons in blue, green, orange, and red, paired with four labeled captions areas on the right.
    Free
    Add to Wishlist
    Download
    AI Customize
    Hexagonal waffle chart with blue, red, and orange sections illustrating proportions and caption areas.
    Add to Wishlist
    Download
    AI Customize
    PPT slide showing a colorful waffle chart with categories Medium, High, and Critical with captions on a white backdrop.