demographic slide powerpoint presentation

Demographic comparison slide with red male and blue female icon, with percentage values and text areas below each.
P.ID : 44156
    556 views
    78 Downloads
    Get Custom Slides by Experts
    Instantly Access Templates in PowerPoint

    Amazing Demographic Slide

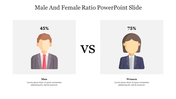
    Stop wasting your precious time making presentations from scratch to showcase the demographic data. Just download our pre-designed, 100% editable demographic PowerPoint slide to make excellent presentations at the stroke of a pen. This slide has two nodes to show the demographic data of men and women. It has creative clipart images and wide text blocks for professionally presenting the descriptions. It will help you evaluate the data more effectively. It will be handy for businesses to understand the trends in consumer demand. Get it today!

    Features of the template

    • 100% customizable slides and easy to download.
    • Slides are available in different nodes & colors.
    • The slide contains 16:9 and 4:3 formats.
    • Easy to change the colors of the slide quickly.
    • Well-crafted template with an instant download facility.
    • The best slide with creative clipart images.
    Advertisement

    You May Also Like These PowerPoint Templates

    Add to Wishlist
    Download
    AI Customize
    Android mobile vs. Apple mobile slides featuring logos of both platforms in different layout designs and icons with text.
    Add to Wishlist
    Download
    AI Customize
    Slide comparing two processes side by side, each with three steps, represented by numbered multi colored boxes.
    Add to Wishlist
    Download
    AI Customize
    Visual comparison of manager versus leader roles using illustrated avatars and lists of traits on a green background.
    Add to Wishlist
    Download
    AI Customize
    Visual slide for comparing two concepts with red and green arrows with placeholder text.
    Add to Wishlist
    Download
    AI Customize
    Comparison slide deck featuring different visual formats like arrows, charts, and hexagons to compare two products.
    Add to Wishlist
    Download
    AI Customize
    A slide with a comparison chart featuring two designs, each with steps and bar graphs in orange, red, blue, green and purple.
    Add to Wishlist
    Download
    AI Customize
    Two rounded rectangles in teal and red with icons and text, arranged side by side, on a white background.
    Add to Wishlist
    Download
    AI Customize
    Comparison slide featuring red and blue hexagons on either side, with seven numbered nodes connected by lines.
    Add to Wishlist
    Download
    AI Customize
    A pack of achievements and challenges slides featuring a comparison of successful outcomes with various colorful designs.
    Add to Wishlist
    Download
    AI Customize
    Force Field Analysis PowerPoint Presentation Diagram
    Add to Wishlist
    Download
    AI Customize
    Comparison slide showing a bar chart with Generation X and Generation Z percentages, along with illustrated characters.
    Add to Wishlist
    Download
    AI Customize
    Gender symbols chart slide with two sections displaying groups of male and female icons, each with percentage markers.
    Free
    Add to Wishlist
    Download
    AI Customize
    Top Notch Comparison Bar Graph PowerPoint Presentation
    Add to Wishlist
    Download
    AI Customize
    A slide showing two gauge meters, one labeled good in green and the other bad in red, indicating performance levels.
    Add to Wishlist
    Download
    AI Customize
    A comparison table slide for limitations and challenges with text fields, offering sections for four items.
    Add to Wishlist
    Download
    AI Customize
    Table comparing GSM and CDMA technologies with key differences on a blue background.
    Add to Wishlist
    Download
    AI Customize
    Comparison layout with orange and red header boxes labeled with online and normal shopping, separated by a blue Vs circle.