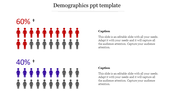
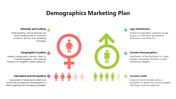
Demographic Infographic PPT Template Design

Infographic Template Design
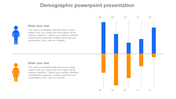
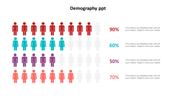
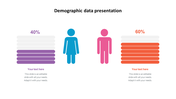
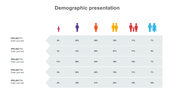
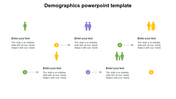
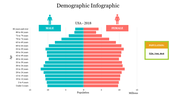
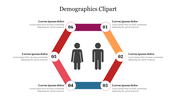
A Demographic Infographic PPT Template Design is a simple and effective way to illustrate various demographic groups and statistics. This two-noded template is highly customizable, offering different color schemes and graphics.
About this template
The Demographic Infographic PPT templates offer data, making them easy to customize. Aside from providing a clear view of demographic data, the templates are easy to download and can be modified. In addition, these multicolors are used to make an eye-catching presentation. Moreover, the design will make the audience fascinated.
Features of this template
- 100 % customizable slides and easy to download.
- Slides are available in different nodes & colors.
- The slide contained in 16:9 and 4:3 format.
- It is easy to change the slide colors quickly.
- It is a well-crafted template with an instant download facility.
- The best PowerPoint theme template.
- It is a well-designed presentation template.


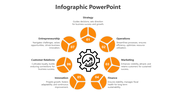
You May Also Like These PowerPoint Templates
Add to Wishlist
Download
Edit

Add to Wishlist
Download
Edit

Add to Wishlist
Download
Edit

Add to Wishlist
Download
Edit

Add to Wishlist
Download
Edit

Add to Wishlist
Download
Edit

Add to Wishlist
Download
Edit

Add to Wishlist
Download
Edit

Add to Wishlist
Download
Edit

Add to Wishlist
Download
Edit

Add to Wishlist
Download
Edit

Add to Wishlist
Download
Edit

Add to Wishlist
Download
Edit

Add to Wishlist
Download
Edit

Add to Wishlist
Download
Edit

Add to Wishlist
Download
Edit

Add to Wishlist
Download
Edit

Add to Wishlist
Download
Edit


Add to Wishlist
Download
Edit
