Dashing Demographic Presentation PowerPoint Model slides

Slide comparing two demographic segments, A and B, with gender icons and corresponding bar charts for three steps.
P.ID : 44153
    379 views
    29 Downloads
    Get Custom Slides by Experts
    Instantly Access Templates in PowerPoint

    PPT Slide for Demographics

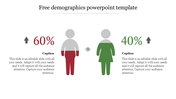
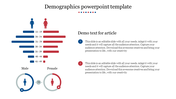
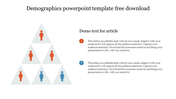
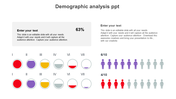
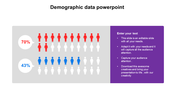
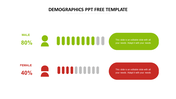
    Our Demographics PPT Template is a tool for helping you learn the ropes of your audience and how they interact with your brand. It allows you to understand the demographic of your audience and how they interact with different products, services, and prices. Usher the driving power behind an Avant marketing method with this slide! Also, the two nodes with human icons depict gender-related demographics. It is also loaded with a spacious text area. You can edit this slide to your taste in a flash. Own it now without any second thoughts.

    Features of the template:

    • 100% customizable slides and easy to download.
    • Slides are available in different nodes & colors.
    • The slide contained 16:9 and 4:3 formats.
    • Easy to change the slide colors quickly.
    • Well-crafted template with an instant download facility.
    • Two nodes are given.
    Advertisement

    You May Also Like These PowerPoint Templates

    Add to Wishlist
    Download
    AI Customize
    Demographic themed slides with various charts and icons to visualize population statistics, including male and female ratios.
    Add to Wishlist
    Download
    AI Customize
    Demographic comparison slide with red male and blue female icon, with percentage values and text areas below each.
    Add to Wishlist
    Download
    AI Customize
    Demographic infographic slide showing four rows of colored icons representing percentages with placeholder text.
    Add to Wishlist
    Download
    AI Customize
    Demographic slide with a bar chart, a segmented human icon, and four descriptive boxes to the right.
    Add to Wishlist
    Download
    AI Customize
    Demographic PowerPoint slide showing population data across four years with different colored icons representing percentages.
    Add to Wishlist
    Download
    AI Customize
    Survey result visualization showing 60% male and 40% female voting intention, displayed with person icons and a chart.
    Add to Wishlist
    Download
    AI Customize
    Chart with blue and orange bars representing male and female demographics, along with icons for each gender.
    Add to Wishlist
    Download
    AI Customize
    Demography PowerPoint template showcasing percentages with colored figures representing data and placeholder text.
    Free
    Add to Wishlist
    Download
    AI Customize
    Market segmentation template with two sections, each featuring a row of figures representing in various colors.
    Add to Wishlist
    Download
    AI Customize
    Survey results template featuring percentages and icons, with 80% represented visually in a red block on the right.
    Add to Wishlist
    Download
    AI Customize
    Demographic layout with colored person icons in red and blue, linked with captions and percentage values.
    Add to Wishlist
    Download
    AI Customize
    Demographic business strategy infographic slide featuring seven key business areas and an icon representing growth.
    Add to Wishlist
    Download
    AI Customize
    Slide showing demographic statistics with orange and pink person icons on either side of a gray shield graphic.
    Add to Wishlist
    Download
    AI Customize
    Slide comparing two demographic segments, A and B, with gender icons and corresponding bar charts for three steps.
    Add to Wishlist
    Download
    AI Customize
    Layout showing blue and red blocks with percentages, a central figure, and step circles for demographic data visualization.