Creative Brazil PowerPoint Presentation Template Design

3D green map of Brazil and national flag, alongside demographics and statistics with icons and percentages.
P.ID : 49296
    262 views
    37 Downloads
    Get Custom Slides by Experts
    Instantly Access Templates in PowerPoint

    Creative Brazil PPT Template 

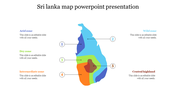
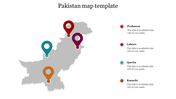
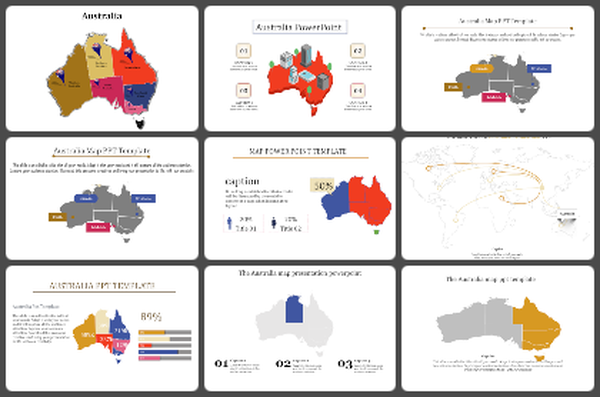
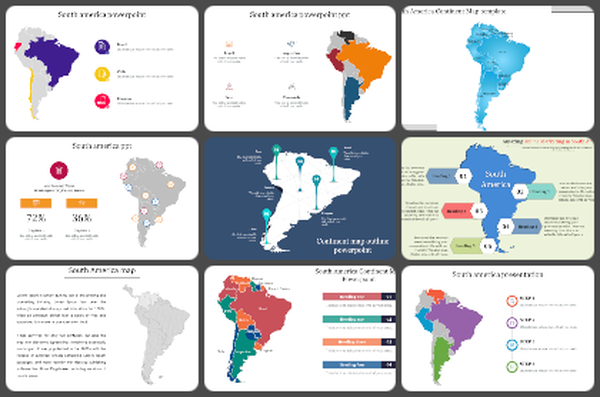
    Download our new Brazil PowerPoint presentation template that can make your overseas business a grand presentation. The template is unique from the Brazil outline. The design is mainly given for the business meeting that is handled in Brazil. 

    The template is given with a white shade that can give a good effect on the background. The template is given with three nodes which are presented in three different designs. The first node is given a caption area, the second with a pie chart with a percentage text area. 

    The third one has small pictograph designs and a percentage tab. The Brazilian flag is also added to denote the country's use, making the understanding process easier. 

    Download this fantastic, fully customized brazil map PowerPoint template now and give 100% satisfaction to your audience.

    Features of this template:

    • It is 100% customizable and straightforward to download.
    • The Slides are available in different nodes & colors.
    • The slide contained 16:9 and 4:3 format.
    • It is easy to change the slide colors quickly.
    • It is a well-crafted template with an instant download facility.
    Advertisement

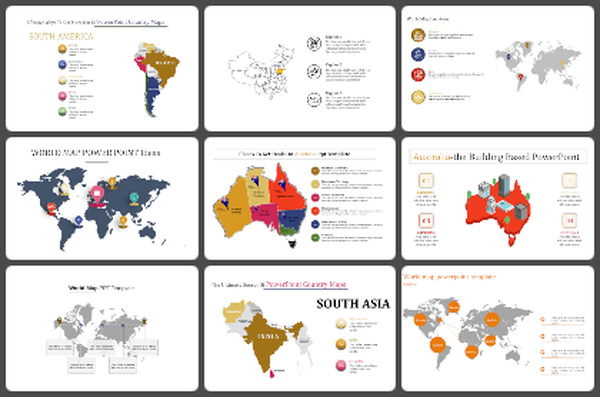
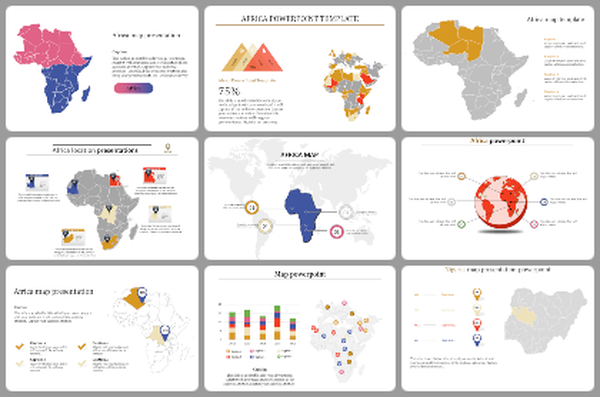
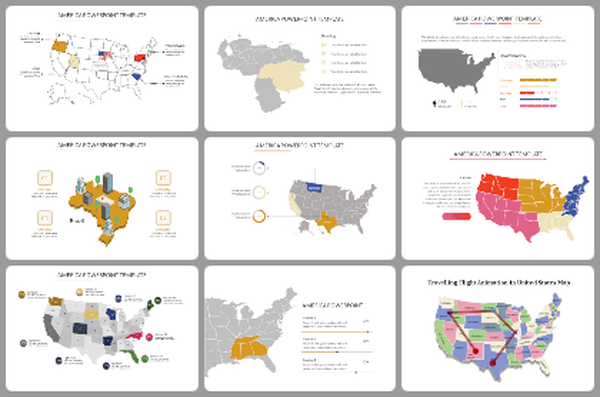
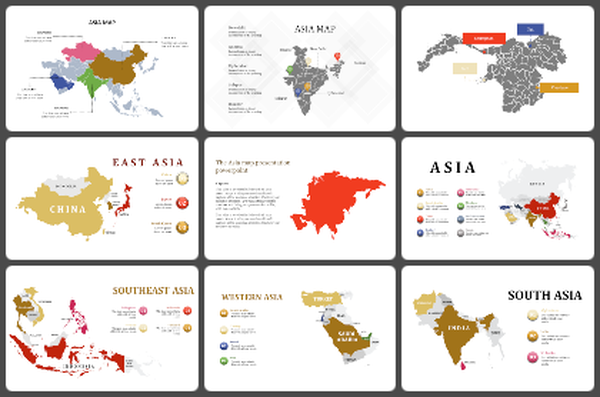
    You May Also Like These PowerPoint Templates

    Add to Wishlist
    Download
    AI Customize
    Colorful world map with continents in green, orange, blue, purple, yellow, and pink, connected to labels with red markers.
    Add to Wishlist
    Download
    AI Customize
    Israel map with cities highlighted in red, teal, and blue, with corresponding numbered captions on both sides.
    Add to Wishlist
    Download
    AI Customize
    Map of Texas in dark grey with three colorful location markers with a percentage area and five numbered text on the right.
    Add to Wishlist
    Download
    AI Customize
    Creative Estonia On World Map Presentation Template
    Add to Wishlist
    Download
    AI Customize
    Germany map slide showing four labeled points across the country with accompanying growth statistics.
    Add to Wishlist
    Download
    AI Customize
    Pakistan map slide with the punjab region highlighted in green, accompanied by a text box for descriptions.
    Add to Wishlist
    Download
    AI Customize
    Slide featuring a map of ukraine, highlighting key cities such as kyiv, ivano frankivsk, and kharkov, with text areas.
    Add to Wishlist
    Download
    AI Customize
    Gray US map with six colored pins in yellow, pink, blue, red, green, and purple, on a white background.
    Add to Wishlist
    Download
    AI Customize
    Outline of France with blue and red borders, featuring three numbered percentage captions on the right.
    Add to Wishlist
    Download
    AI Customize
    Infographic showing demographic data in a PowerPoint slide with red and blue figures with placeholder text.
    Free
    Add to Wishlist
    Download
    AI Customize
    Slide displaying gender demographics with a male in green and a female in red representation with percentages.
    Add to Wishlist
    Download
    AI Customize
    Demographic themed slides with various charts and icons to visualize population statistics, including male and female ratios.
    Add to Wishlist
    Download
    AI Customize
    Demographic comparison slide with red male and blue female icon, with percentage values and text areas below each.
    Add to Wishlist
    Download
    AI Customize
    Demographic infographic slide showing four rows of colored icons representing percentages with placeholder text.
    Add to Wishlist
    Download
    AI Customize
    Demographic slide with a bar chart, a segmented human icon, and four descriptive boxes to the right.
    Add to Wishlist
    Download
    AI Customize
    Demographic PowerPoint slide showing population data across four years with different colored icons representing percentages.
    Add to Wishlist
    Download
    AI Customize
    Survey result visualization showing 60% male and 40% female voting intention, displayed with person icons and a chart.
    Add to Wishlist
    Download
    AI Customize
    Chart with blue and orange bars representing male and female demographics, along with icons for each gender.