Editable NC State Outline Map Presentation Slide PPT

Outline map of North Carolina with five colored dots marking major cities and names with descriptions on the right.
P.ID : 64408
    98 views
    9 Downloads
    Get Custom Slides by Experts
    Instantly Access Templates in PowerPoint

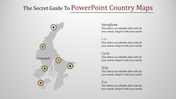
    Five Noded NC State Map PPT Slide

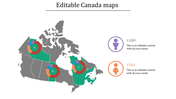
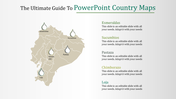
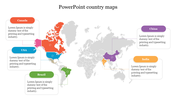
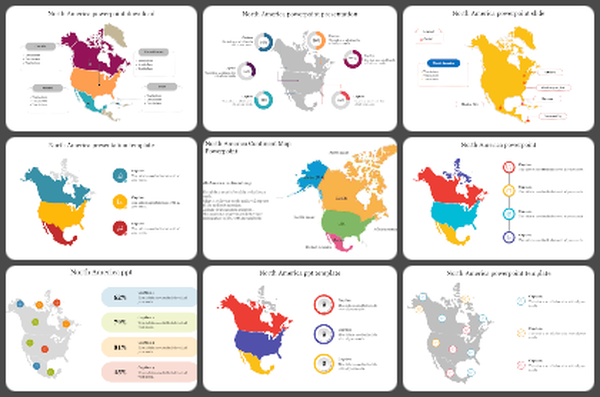
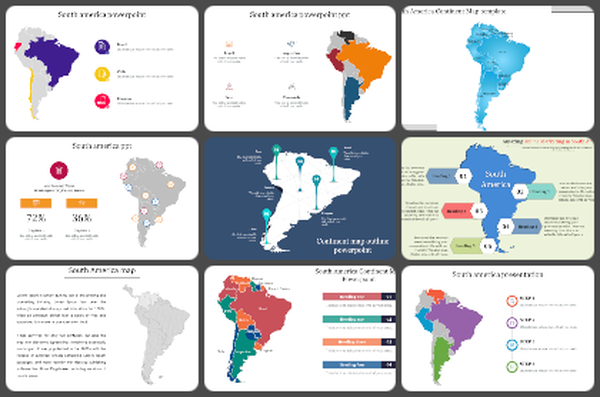
    Make a professional-looking presentation about North Carolina using this NC State Outline Map PowerPoint Template. This map PowerPoint slide will help your audience visualize the state's topography and other data in an easy-to-use way. It is fully editable and easy to customize. You can use this template for an interactive, informative, and effective presentation. Hurry to grab!


    The NC State Outline Map PowerPoint Template is well-crafted, in which five states are highlighted with attractive color dots. It has a legend with five states' names. It has a clear typography, which will enable your audience to follow your presentation easily. This outline map can be used for any type of presentation, whether for business, education, or personal purposes. 


    Features of this template:

    1. 100% customizable slides and easy to download.

    2. Slides available in different nodes & colors.

    3. The slide contained 16:9 and 4:3 format.

    4. Easy to change the slide colors quickly.

    5. Well-crafted template with instant download facility.

    6. It has a well-designed outline map.

    Advertisement

    You May Also Like These PowerPoint Templates

    Add to Wishlist
    Download
    AI Customize
    Taiwan map slide with three colored circular markers displaying percentages and each with caption areas.
    Add to Wishlist
    Download
    AI Customize
    Tokyo map with highlighted districts in various colors, and numbered labels for six areas on both sides.
    Add to Wishlist
    Download
    AI Customize
    United Arab Emirates map in the center with regions, and six caption areas in different colors on the left and right.
    Add to Wishlist
    Download
    AI Customize
    Argentina map with highlighted regions in yellow, orange, purple, and magenta, each labeled with caption areas.
    Add to Wishlist
    Download
    AI Customize
    Map highlighting Morocco and surrounding regions in colorful sections with caption areas below.
    Add to Wishlist
    Download
    AI Customize
    Map of Southeast Asia highlighting four countries thailand, laos, cambodia, and vietnam, with labeled regions.
    Add to Wishlist
    Download
    AI Customize
    PowerPoint slide showcasing a map of Minnesota, highlighting major cities and the state capital.
    Add to Wishlist
    Download
    AI Customize
    Saudi Arabia PPT Presentation Template and Google Slides
    Add to Wishlist
    Download
    AI Customize
    Stylized slide deck of map of Russia  with diverse color-coded regions, highlighting geographical areas.
    Add to Wishlist
    Download
    AI Customize
    Slide featuring a map of Japan with color coded regions and three percentage indicators alongside captions for each.
    Add to Wishlist
    Download
    AI Customize
    Map of South Africa highlighting regions, with percentage labels and colored markers in  a white background.
    Add to Wishlist
    Download
    AI Customize
    Four Taiwan map outlines with percentage labels in red, blue, purple, and green, each with text areas.
    Add to Wishlist
    Download
    AI Customize
    Map Of Thailand Infographics PowerPoint And Google Slides
    Add to Wishlist
    Download
    AI Customize
    Map of Southeast Asia featuring infographics slides with color coded regions, percentage data, and statistical charts.
    Add to Wishlist
    Download
    AI Customize
    Map of Paris region with orange highlight and demographic icons showing percentage data alongside two circular charts.
    Add to Wishlist
    Download
    AI Customize
    Color coded UK map slide highlighting northern ireland, scotland, wales, and england with captions for each region.
    Add to Wishlist
    Download
    AI Customize
    Africa map showing highlighted countries in green, red, blue, yellow, and brown, with a corresponding bar chart.