Free - Make Use Of Our Editable Analysis Presentation Template

Free
Red circular analysis infographic with six labeled segments, and descriptions around a central data icon.
P.ID : 36818
    275 views
    119 Downloads
    Get Custom Slides by Experts
    Instantly Access Templates in PowerPoint

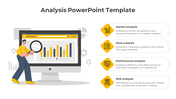
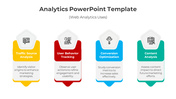
    Analysis Presentation Template: Empowering Your Insights


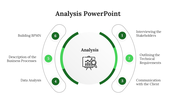
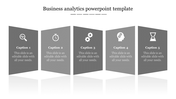
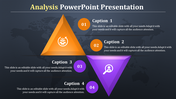
    Unlock the potential of your data with our Analysis Presentation Template! This dynamic PowerPoint slide features a captivating design, centered around a double-layered white circle symbolizing growth. Surrounding it are six elegantly shaded red petals, resembling a blooming flower, each adorned with icons and text areas for comprehensive analysis.Designed for business professionals, students, or anyone seeking impactful presentations, this template offers versatility and ease of use. 

    Seamlessly integrate data, charts, and insights into your presentations, captivating your audience with visually engaging slides. Whether you're delivering a sales pitch, academic presentation, or business report, our template empowers you to convey your message effectively. Don't miss out on this opportunity to enhance your storytelling and analysis skills! Download our Analysis Presentation Template now and unleash the power of your data-driven narratives!

    Features of the template

    • 100% customizable slides and easy to download.
    • Slides are available in different colors
    • The slide has 4:3 and 16:9 formats.
    • Easy to change the slide colors quickly.
    • Appealing Presentation to impress an audience.
    • Create feature-rich slide presentations. 
    • An eye-pleasing color slide helps to give a catchy display.
    • Highly compatible with PowerPoint and Google Slides.
    Advertisement

    You May Also Like These PowerPoint Templates

    Add to Wishlist
    Download
    AI Customize
    Four staggered colored bars in blue, green, yellow, and purple with icons and captions aligned horizontally.
    Add to Wishlist
    Download
    AI Customize
    Stakeholder analysis slide showing a group of professionals discussing laptops in a meeting room.
    Add to Wishlist
    Download
    AI Customize
    Central speedometer icon with curved black line and five connected colored circles linking labeled sections.
    Add to Wishlist
    Download
    AI Customize
    Three segmented semi circular diagram in blue tones with icons, and a black magnifying glass overlaying a head symbol.
    Free
    Add to Wishlist
    Download
    AI Customize
    Vertical bar chart with five captions and a magnifying glass highlighting one, and numbered list with text on the right.
    Free
    Add to Wishlist
    Download
    AI Customize
    Business slide with two numbered green markers, a magnifying glass over coins, and a group of people analyzing a chart.
    Add to Wishlist
    Download
    AI Customize
    Slide featuring four circular progress charts in yellow, pink, blue, and green, with captions on a gray background.
    Add to Wishlist
    Download
    AI Customize
    Analysis PowerPoint template featuring four colorful stages from data interpretation to risk Assessment with icons.
    Add to Wishlist
    Download
    AI Customize
    Three head silhouettes in blue and gray with icons, connected by arrows with captions below, on a white background.
    Add to Wishlist
    Download
    AI Customize
    Analysis PowerPoint template displaying a blue circular diagram with steps from interviewing stakeholders to building BPMN.
    Add to Wishlist
    Download
    AI Customize
    Six oval elements in gray with icons and labels for analysis categories placed in white backdrop.
    Add to Wishlist
    Download
    AI Customize
    Modern design featuring a circular orange arc in the center, flanked by six numbered steps on curved paths on both sides.
    Add to Wishlist
    Download
    AI Customize
    Three vertical blocks in yellow, blue, and green, each with numbers and business analytics icons on a light background.
    Add to Wishlist
    Download
    AI Customize
    A pack of DESC model slides with four elements in various colorful layout designs with text descriptions.
    Add to Wishlist
    Download
    AI Customize
    Circular flowchart with colored arrows in blue, purple, orange, and yellow, pointing to icons and text areas beneath.
    Add to Wishlist
    Download
    AI Customize
    Four step layout with colored tabs in orange, blue, green, and purple, featuring icons and white text boxes.
    Add to Wishlist
    Download
    AI Customize
    A strategic analysis format diagram with a triangle structure representing political, economic, and technological factors.