Best Situation Analysis Download Slide Template Designs

Situation analysis PPT slide featuring icons for industry research and firm capabilities with captions in two colored boxes.
P.ID : 50968
    252 views
    32 Downloads
    Get Custom Slides by Experts
    Instantly Access Templates in PowerPoint

    Best Situation Analysis Template With Two Nodes

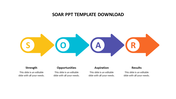
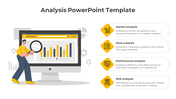
    Situation Analysis helps you to understand the environment in which a plan is to be executed. If you want to identify the opportunities and challenges, both internal and external, to your industries, then download our situation analysis slide. The PowerPoint has two text areas with icons. It is a great way to keep things visually interesting, and without wasting your efforts, you can easily add the report to the text areas and engage your audience.

    Features of the template

    • 100% Customizable (shape color, size & text)
    • Drag and drop image placeholder
    • Pack of best PPT to impress your audience
    • This slide supports the 16:9 and 4:3 formats
    • Easy to change the slide shades
    • You can use it in Google Slides and Microsoft PowerPoint.
    • It is a well-crafted slide with an instant download facility.
    Advertisement

    You May Also Like These PowerPoint Templates

    Add to Wishlist
    Download
    AI Customize
    Business Analytics slide featuring three stages with icons representing question, insight, and growth.
    Add to Wishlist
    Download
    AI Customize
    Data analysis template with a bar graph and illustrated dashboard layout with two caption areas for data.
    Add to Wishlist
    Download
    AI Customize
    Illustration of a person analyzing charts in blue accents, with four analysis types listed on the right.
    Add to Wishlist
    Download
    AI Customize
    Four colorful vertical banners in yellow, red, blue, and green with icons, title, and descriptions for web analytics uses.
    Add to Wishlist
    Download
    AI Customize
    Data analysis featuring icons for data interpretation, market research, and performance evaluation.
    Add to Wishlist
    Download
    AI Customize
    Competitor analysis chart with four quadrants representing high and low price and quality, showing competitor circles.
    Free
    Add to Wishlist
    Download
    AI Customize
    Amazing Business Analytics PPT Templates and Google Slides
    Add to Wishlist
    Download
    AI Customize
     slide featuring three circular charts for data analysis, followed by a line chart displaying monthly trends.
    Add to Wishlist
    Download
    AI Customize
    Four blue pin markers with circular bases in a zigzag pattern, each labeled with percentages and descriptive captions.
    Add to Wishlist
    Download
    AI Customize
    Cross layout with four circular icons in gold tones, each linked by dotted lines, and captions listed vertically on right.
    Add to Wishlist
    Download
    AI Customize
    Slide with an orange upright and a purple inverted triangle, each featuring icons and four numbered captions around them.
    Add to Wishlist
    Download
    AI Customize
    Analysis slide featuring a magnifying glass over banana, with three circular progress charts in green, orange, and yellow.
    Add to Wishlist
    Download
    AI Customize
    Business analytics slide featuring a circular pie chart with percentages representing different business data segments.
    Add to Wishlist
    Download
    AI Customize
    Four staggered colored bars in blue, green, yellow, and purple with icons and captions aligned horizontally.
    Add to Wishlist
    Download
    AI Customize
    Stakeholder analysis slide showing a group of professionals discussing laptops in a meeting room.
    Add to Wishlist
    Download
    AI Customize
    Central speedometer icon with curved black line and five connected colored circles linking labeled sections.
    Add to Wishlist
    Download
    AI Customize
    Four hexagons in red, blue, yellow, and green, each with a relevant financial icon and captions around it.