Free - Attractive Analysis PowerPoint Template Slide Designs

Free
Analysis PowerPoint slide featuring a bar graph and vehicle icons with placeholders for text and subheadings.
P.ID : 33734
    318 views
    81 Downloads
    Get Custom Slides by Experts
    Instantly Access Templates in PowerPoint

    Analysis PowerPoint Template and Google Slides Themes


    Looking to convey impactful insights through your presentations? Explore our Analysis PowerPoint templates designed to enhance your message effectively.

    About our slide

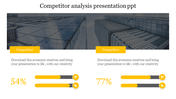
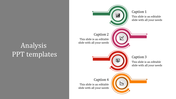
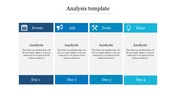
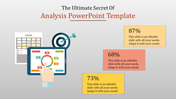
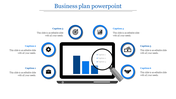
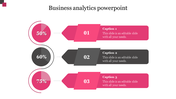
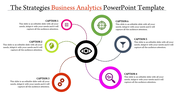
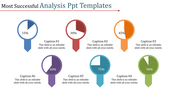
    Our Analysis templates are crucial for visualizing data trends, interpreting findings, and presenting analytical results. It features a bar graph image and vehicle icons, these templates make it easy to illustrate comparisons, statistical data, and performance metrics effortlessly.

    Slide Purpose

    The main goal of our PowerPoint template is to simplify complex data into clear insights. Highlight trends, comparisons, and key metrics to ensure your audience quickly understands the significance of your analysis.


    Who Can Benefit?

    Professionals in finance, marketing, consulting, and academia can benefit greatly from our Analysis templates.

    Download Now!


    Features of the template:

    • 100% customizable slides and easy to download.
    • The slides contain 16:9 and 4:3 formats.
    • Easy to change the colors quickly.
    • It is a 100% pre-designed slide.
    Advertisement

    You May Also Like These PowerPoint Templates

    Add to Wishlist
    Download
    AI Customize
    A colorful risk analysis matrix slide chart, displaying low, medium, high, and extreme risk levels in a grid format.
    Add to Wishlist
    Download
    AI Customize
    Linear timeline showing red triangular nodes connected by dots, each node containing an icon and caption.
    Add to Wishlist
    Download
    AI Customize
    Attractive Business Analytics PowerPoint Template Design
    Add to Wishlist
    Download
    AI Customize
    Business analysis slide with a central pink gradient circle surrounded by  six colorful icons with text, on a gray backdrop.
    Add to Wishlist
    Download
    AI Customize
    A person working on a laptop with analysis data, alongside bar charts with percentage and text box, on a gray background.
    Add to Wishlist
    Download
    AI Customize
    Colorful SOAR Model PowerPoint slide with circles and icons with strength, opportunities, aspirations, and results.
    Add to Wishlist
    Download
    AI Customize
    Analytics slide with line graph, pie chart, and statistics showing 13M views, 13M active subscribers, and 991K subscribers.
    Add to Wishlist
    Download
    AI Customize
    Performance PPT And Google Slides Themes For Your Needs
    Add to Wishlist
    Download
    AI Customize
    Market analysis PowerPoint slide featuring a pie chart with labeled segments and captions for each market category.
    Add to Wishlist
    Download
    AI Customize
    Analysis presentation slide showing a technology growth chart with percentage values and icons with placeholder text.
    Free
    Add to Wishlist
    Download
    AI Customize
    Best Scenario Analysis Presentation Template Slides
    Add to Wishlist
    Download
    AI Customize
    Buy Affordable Data Analysis Presentation Template
    Add to Wishlist
    Download
    AI Customize
    Customize Feasibility Study PPT And Google Slides Themes
    Add to Wishlist
    Download
    AI Customize
    Analysis PPT slide with four colorful text boxes and unique icons for each stage of the process with captions.
    Add to Wishlist
    Download
    AI Customize
    Yellow pie chart divided into Analysis 1, 2, and 3 segments, focused by a black magnifying glass icon.
    Add to Wishlist
    Download
    AI Customize
    Graph with three numbered curves in green, orange, and red, with corresponding text on the right.