Effective Data Analytics Presentation Template Slide


Colorful Data Analytics Presentation Slide
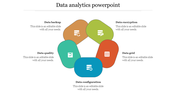
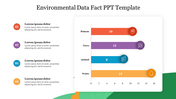
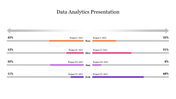
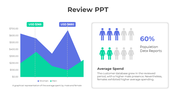
Get this data analytics presentation slide; it helps analyze the survey responses, interviews, and emails. It gives an overview of web analytics. It is a collection of data that is used to support decision-making. Try this analytics slide to make the audience get beneficial through this slide.
About the template:
Grab this data analytics presentation with a white background that enhances your slide's quality. It has data statics in various percentages that are differentiated in various colors. The template contains editable texts that are modifiable for you to add additional information to the template. You can customize the template with various features provided by SlideEgg.
Download this analysis slide for an informative presentation to the audience that helps with the decision-making of an individual. And try our other slides of the presentation on data analytics from SlideEgg.
Features of the slide:
1.100% customizable slides and easy to download.
2. Slides available in different nodes & colors.
3. The slides contained 16:9 and 4:3 formats.
4. Easy to change the slide colors quickly.
5. Well-crafted template with instant download facility.
6. The analysis slide for the PPT presentation.


You May Also Like These PowerPoint Templates
Add to Wishlist
Download
AI Customize

Add to Wishlist
Download
AI Customize

Add to Wishlist
Download
AI Customize

Add to Wishlist
Download
AI Customize

Add to Wishlist
Download
AI Customize

Add to Wishlist
Download
AI Customize

Add to Wishlist
Download
AI Customize

Add to Wishlist
Download
AI Customize


Add to Wishlist
Download
AI Customize

Add to Wishlist
Download
AI Customize

Add to Wishlist
Download
AI Customize

Add to Wishlist
Download
AI Customize

Add to Wishlist
Download
AI Customize

Add to Wishlist
Download
AI Customize

Add to Wishlist
Download
AI Customize

Add to Wishlist
Download
AI Customize

Add to Wishlist
Download
AI Customize

Add to Wishlist
Download
AI Customize

Add to Wishlist
Download
AI Customize
